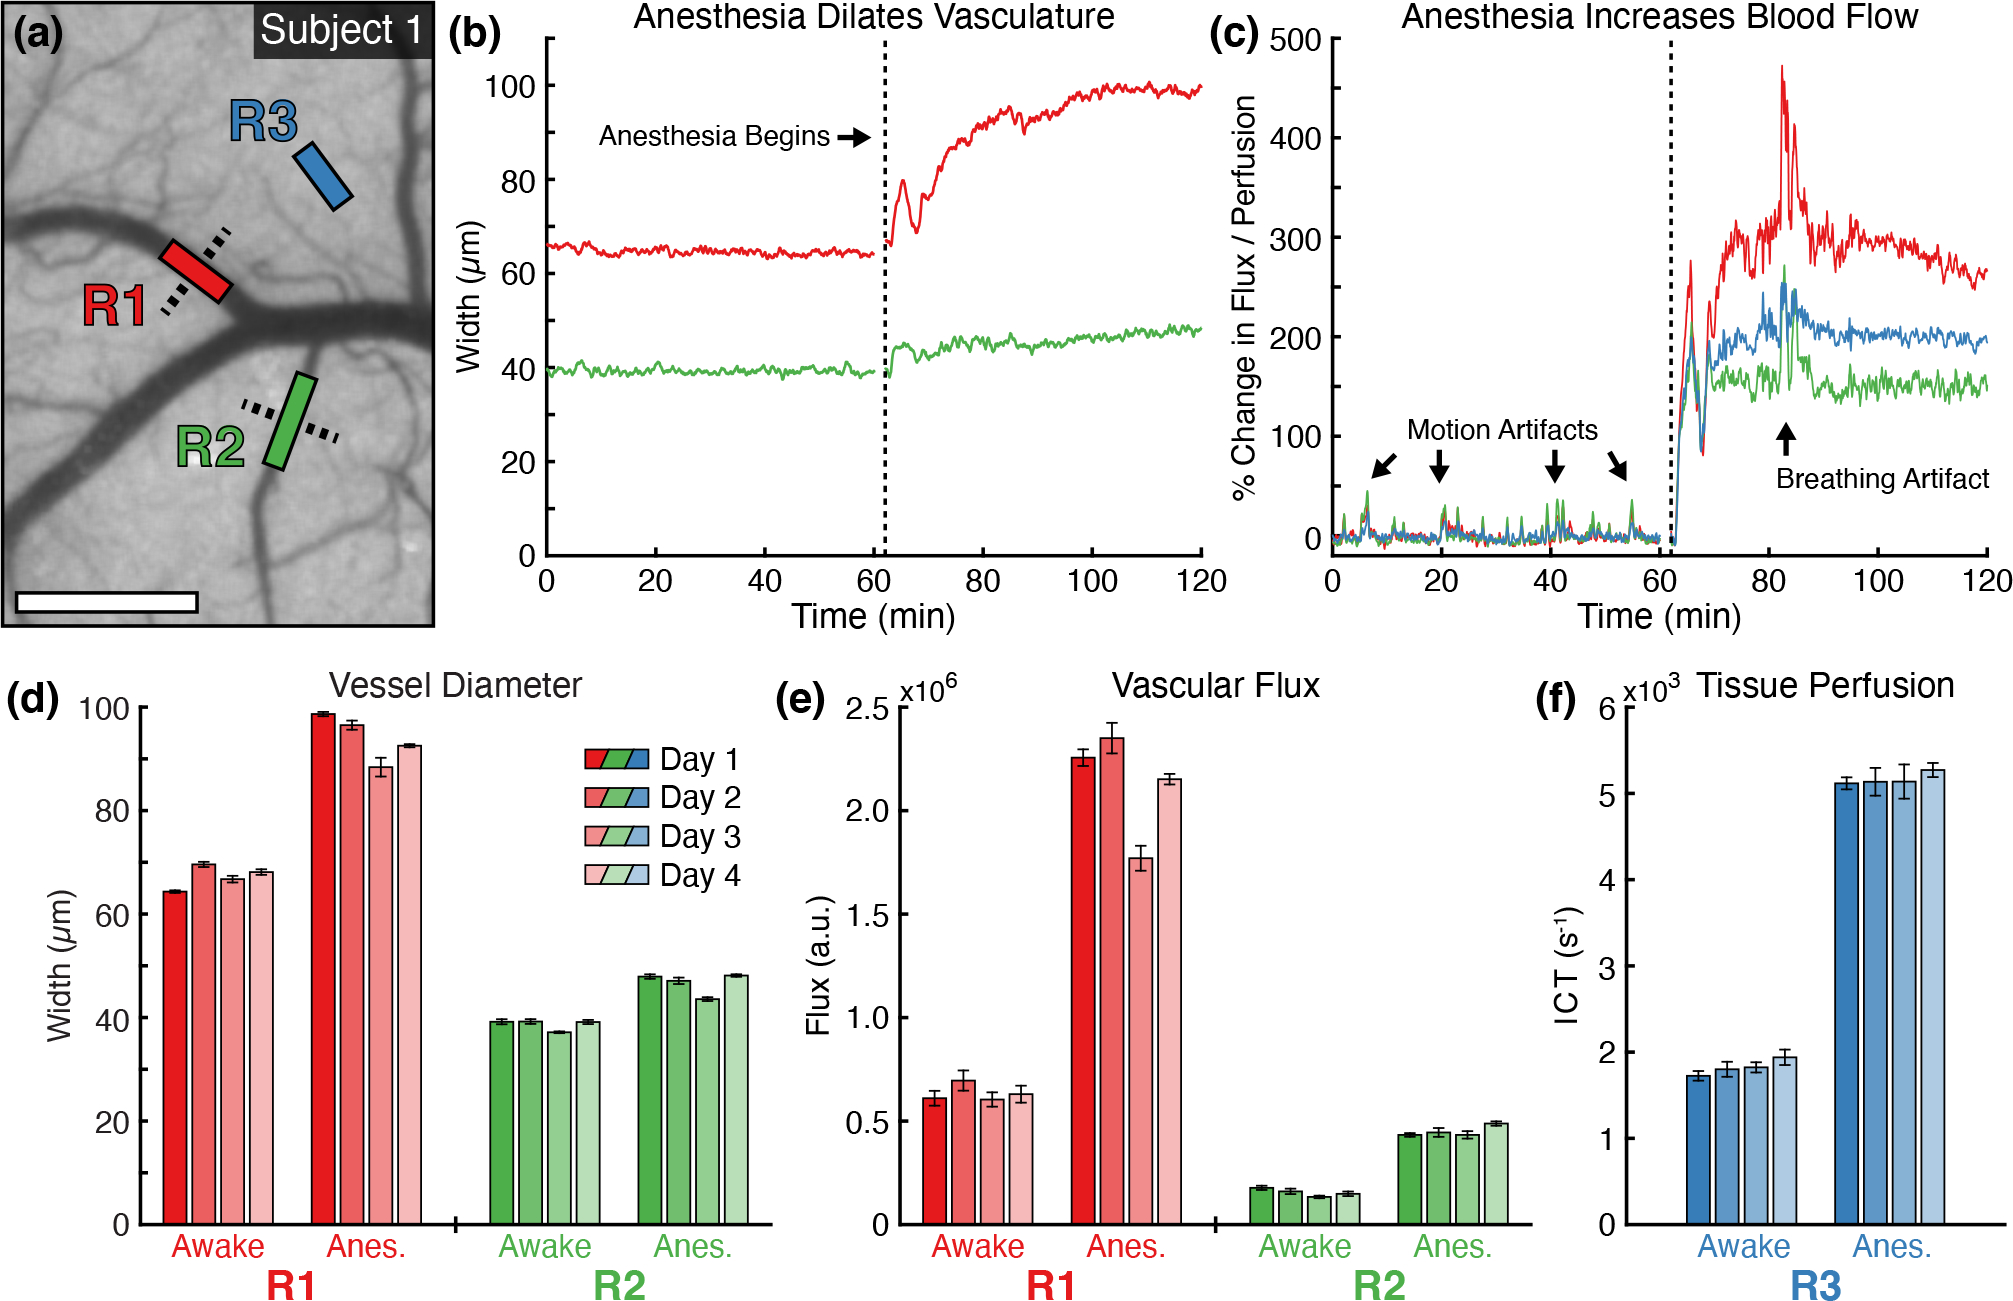
Figure 2:

(a) Awake speckle contrast image (5 ms) from Subject 1 overlaid with vascular (R1 and R2) and parenchyma (R3) regions used during flow analysis (Scale bar = 500 μm). Dashed lines indicate the cross-sectional profiles used to calculate vessel width. Timecourses of (b) vessel diameter and (c) percent change in blood flow within the regions over the extended two-hour imaging session. The vertical dashed line indicates the beginning of anesthesia induction. The percent change in vascular flux and tissue perfusion in (c) were computed using the average of the entire awake state for the baseline. Repeated measurements of (d) vessel diameter, (e) vascular flux, and (f) parenchyma tissue perfusion during awake and anesthetized states in Subject 1 across four imaging sessions (mean ± sd). Statistics computed across the 50 MESI frames acquired in each state.
