. 2022 Jul 5:M22-1300. doi: 10.7326/M22-1300

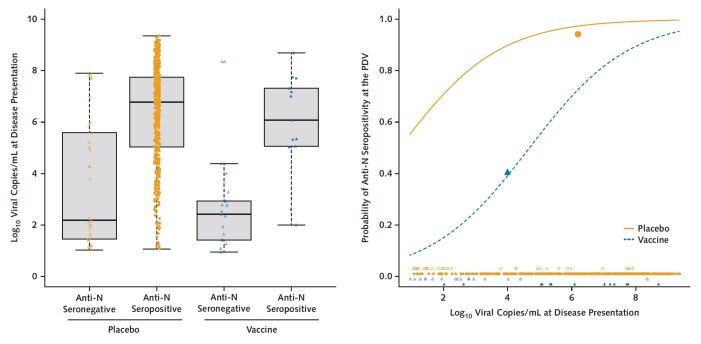
Figure 2. Relationship between viral level at disease presentation and anti-N serostatus at the PDV, by group.

Figure 2. Relationship between viral level at disease presentation and anti-N serostatus at the PDV, by group. Closed and open shapes denote anti-N seropositive and anti-N seronegative cases, respectively. Left. Log10 viral copies/mL at disease presentation for placebo (orange circles) and vaccine (blue triangles) groups, by PDV anti-N serostatus. Right. Predicted probability of PDV anti-N seropositivity, by group. The 2 large closed shapes are plotted at the mean viral level and the mean PDV anti-N seropositivity rates, respectively, by group. N = nucleocapsid; PDV = participant decision visit.

Closed and open shapes denote anti-N seropositive and anti-N seronegative cases, respectively. Left. Log10 viral copies/mL at disease presentation for placebo (orange circles) and vaccine (blue triangles) groups, by PDV anti-N serostatus. Right. Predicted probability of PDV anti-N seropositivity, by group. The 2 large closed shapes are plotted at the mean viral level and the mean PDV anti-N seropositivity rates, respectively, by group. N = nucleocapsid; PDV = participant decision visit.