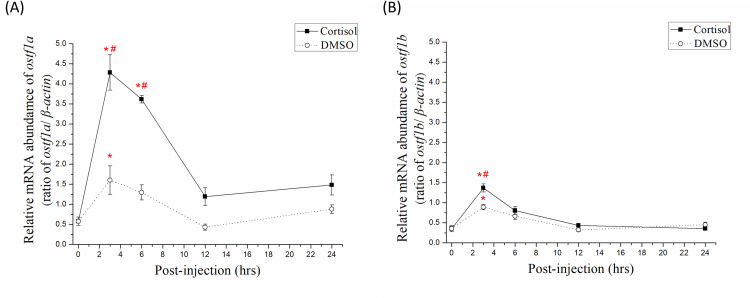
Fig 5. Time-course mRNA abundance of (A) ostf1a and (B) ostf1b in gills of FW-acclimated milkfish after injection with cortisol and DMSO for 24 h.
The abundance has been normalized according to the expression of β-actin. Values were shown in mean ± S.E.M. Treatment group, n = 6; control group, n = 4. The asterisks indicated significant differences between each time-point and 0 h (p < 0.05, analyzed by Kruskal–Wallis test with Dunn’s multiple comparisons test). The sharps indicated significant differences between the cortisol group and DMSO group at the same time-point (p < 0.05, analyzed by Mann–Whitney test).

