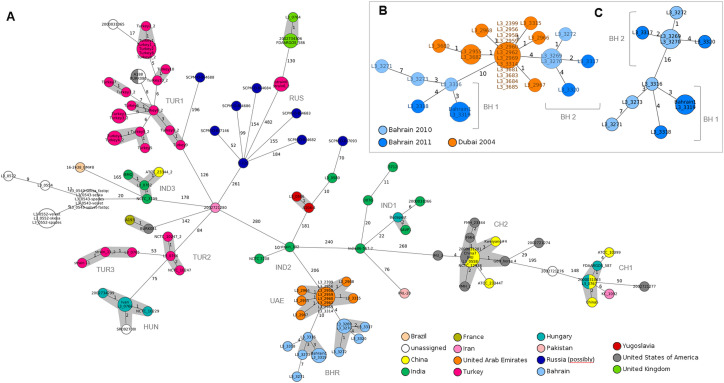
Fig 1. Minimum spanning tree visualizing the clustering of B. mallei strains.
(A) Allelic differences and spatial clustering of B. mallei strains dependent on the reported geographical origin. (B) Allelic differences of outbreak strains from Dubai and Bahrain. (C) Direct comparison of cgMLST profiles of B. mallei strains from Bahrain to specify allelic differences within the outbreak cluster. Since the outbreak strains form the United Arab Emirates are excluded in this analysis, the allelic differences vary from the figures shown in (A) and (B). The Bahrain B. mallei strain formed two distinct clusters: BH1 and BH2. The Minimum Spanning Tree was reconstructed on results provided by the cgMLST analysis. Each sequence type is represented by a single node, nodes are connected if they are single locus variants. The size of nodes refers to the number of genomes with identical locus variants. The color of nodes reflects the reported geographical origin of the B. mallei strain. For each identified spatial cluster, the internal three-letter code is provided. Each B. mallei strain is identified by a unique identifier. Numbers along the branches indicate allelic differences. Nodes with less than 3 allelic differences to each other are shaded in grey.

