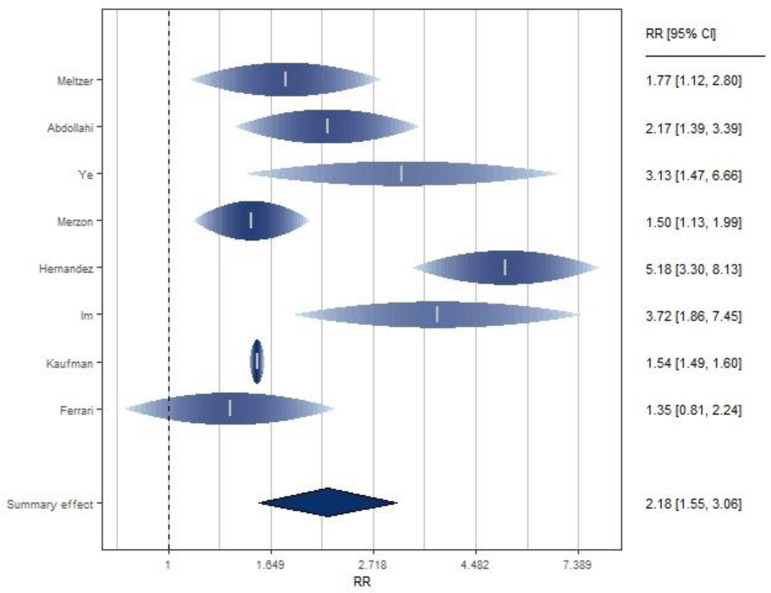
Fig 2. Forest plot of risk estimates of infection for low vs high vitamin D levels.
Forest plot: Ticks represent effect estimates of individual studies with their 95% confidence intervals. Raindrops and shading represent the probability density for a probability of 0.95 with height of raindrop and color saturation proportional to the weight assigned to the study in the meta-analysis. The diamond represents the overall result and 95% confidence interval of the fixed-effect meta-analysis.

