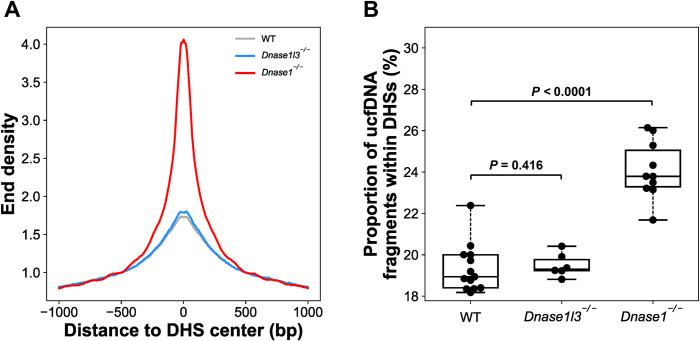
Fig 7. End density of the ucfDNA fragments within the DHSs.
(A) End density of ucfDNA fragments across the regions close to the DHSs. The grey, blue and red lines represent the median end density derived from WT (n = 13), Dnase1l3-/- (n = 6), and Dnase1-/- groups (n = 10), respectively. (B) Proportion of ucfDNA fragments falling within the DHSs.

