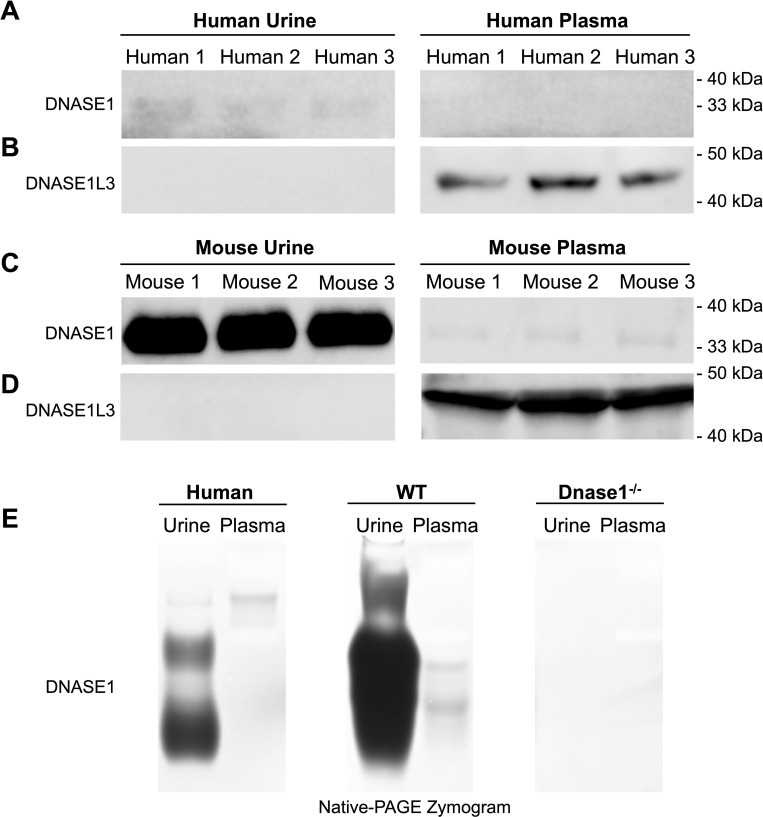
Fig 8. Western blot and zymogram analysis of DNASE1 and DNASE1L3 in urine and plasma samples from healthy human subjects and C57BL/6 mice.
Urine (left three) and plasma (right three) samples (2 μl/lane) from three human subjects were subjected to SDS-PAGE and then immunoblotted with anti-DNASE1 antibody (Abcam ab113241) (A) and anti-DNASE1L3 antibody (Abcam ab152118) (B). The same western blot experiment was performed for murine urine (left three) and plasma (right three) samples against anti-DNASE1 antibody (Abcam ab113241) (C) and anti-DNASE1L3 antibody (Abcam ab152118) (D). Urine and plasma samples (2 μl/lane) from human subjects and mice were loaded on the native PAGE gel containing plasmid DNA (pcDNA3.1 Invitrogen) (E). Bands represent the existence of nuclease activity to digest plasmid DNA. Samples from Dnase1-/- mice (right) serve as a control. Molecular weight markers (Bio-platform BP106) were used to estimate the sizes of the respective proteins in the immunoblotting. Chemiluminescence detection and gel imaging were performed using ChemiDoc MP Imaging Systems (Bio-Rad Laboratories). The experiments were repeated three times, and one representative experiment with three biological replicates was shown in western blot and zymogram.

