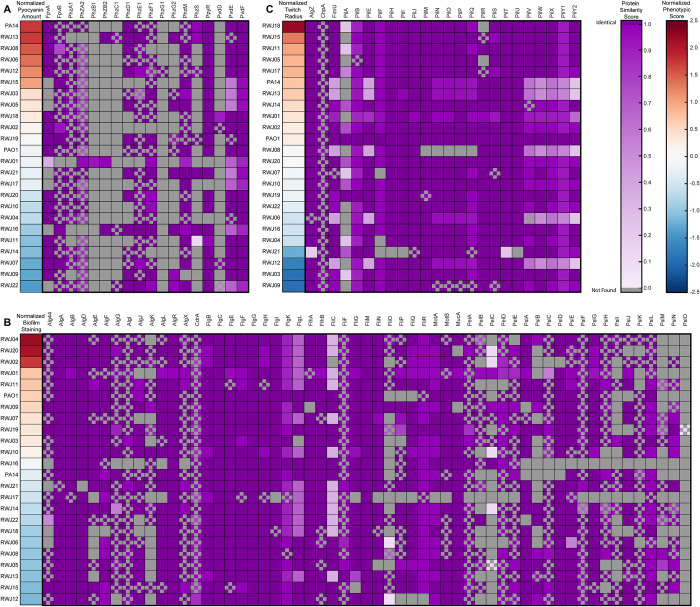
Fig 4. Protein similarity amongst strains shows high homology amongst most genes.
Genes involved in the (A) pyocyanin and pyoverdine, (B) biofilm, (C) twitching were compared for similarity. (Left) Strains are ordered by their normalized phenotypic score from dark red indicating high to dark blue indicating low. (Right) Similarity scores between the gene in published PAO1 reference genome and ORF from our assembly. Dark purple on indicates 100 percent similarity with decreasing saturation indicating decreasing similarity. Gray boxes indicate that the gene was not found in the scaffolds of the strain and could indicate a loss of the gene or be the result of incomplete assembly of contigs. Checkerboard pattern indicates that the ORF was found running up to the edge of a contig and was scored based on the portion of the protein present. PA14 and PAO1 comparisons shown are based on our de novo assembly of these strains to provide a baseline for our sequencing and assembly pipeline. For scores calculated based on full length template see S1 Fig.

