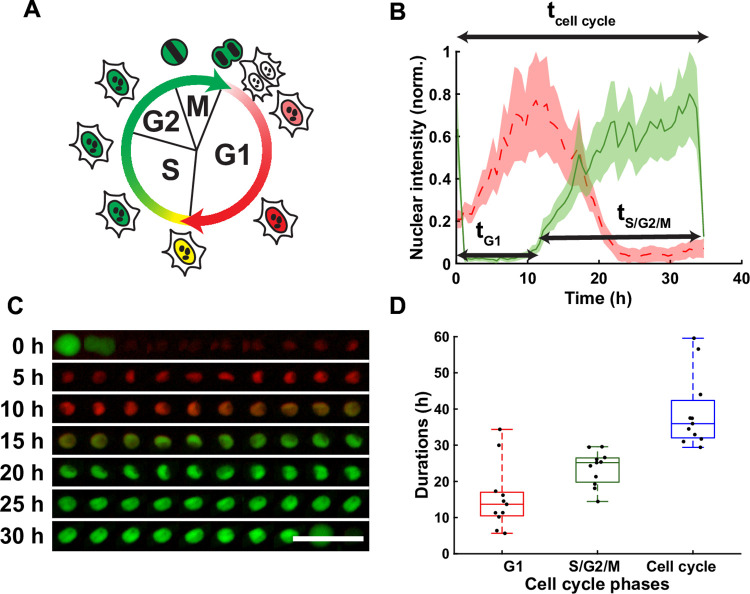
Fig 3. Single cell tracking with the FUCCI2 system.
(A) FUCCI2 cartoon representing the mCherry (red) and mVenus (green) fluorescence of the nucleus during the cell cycle. (B) Normalized fluorescence intensity in mCherry (dashed red) and mVenus (green) for Cell #8, with the corresponding duration of the phases. The line is the average, and the shaded area is the standard deviation. (C) Corresponding fluorescence images of the segmented nucleus over time. Scale bar is 100 μm. (D) Duration in hours of the cell cycle phases: G1 (red), S/G2/M (green) and total cell cycle (blue). The FUCCI2 cartoons was adapted from Sakaue-Sawano et al. [1], Copyright (2008), with permission from Elsevier.

