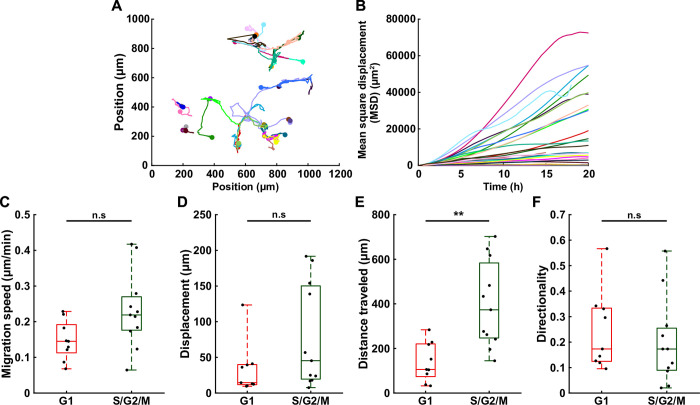
Fig 4. Cell migration analysis correlated with cell cycle state using the FUCCI2 system.
(A) Trajectories of MDA-FUCCI2 cells during their cell cycle. (B) Corresponding mean square displacement (MSD) for every cell tracked (n = 24 cells). (C-F) Boxplots showing the difference between cell cycle state of MDA-FUCCI2 daughter cells (n = 11 cells) according to 4 migration features: (C) migration speed, (D) displacement (distance from beginning to end of trajectory), (E) total distance (total trajectory length) and (F) directionality (ratio displacement to total distance). Statistical analysis with respect to the control using a two-tailed Wilcoxon rank sum test, n.s: p > 0.05, *: p < 0.05, **: p < 0.01 and ***: p < 0.001.

