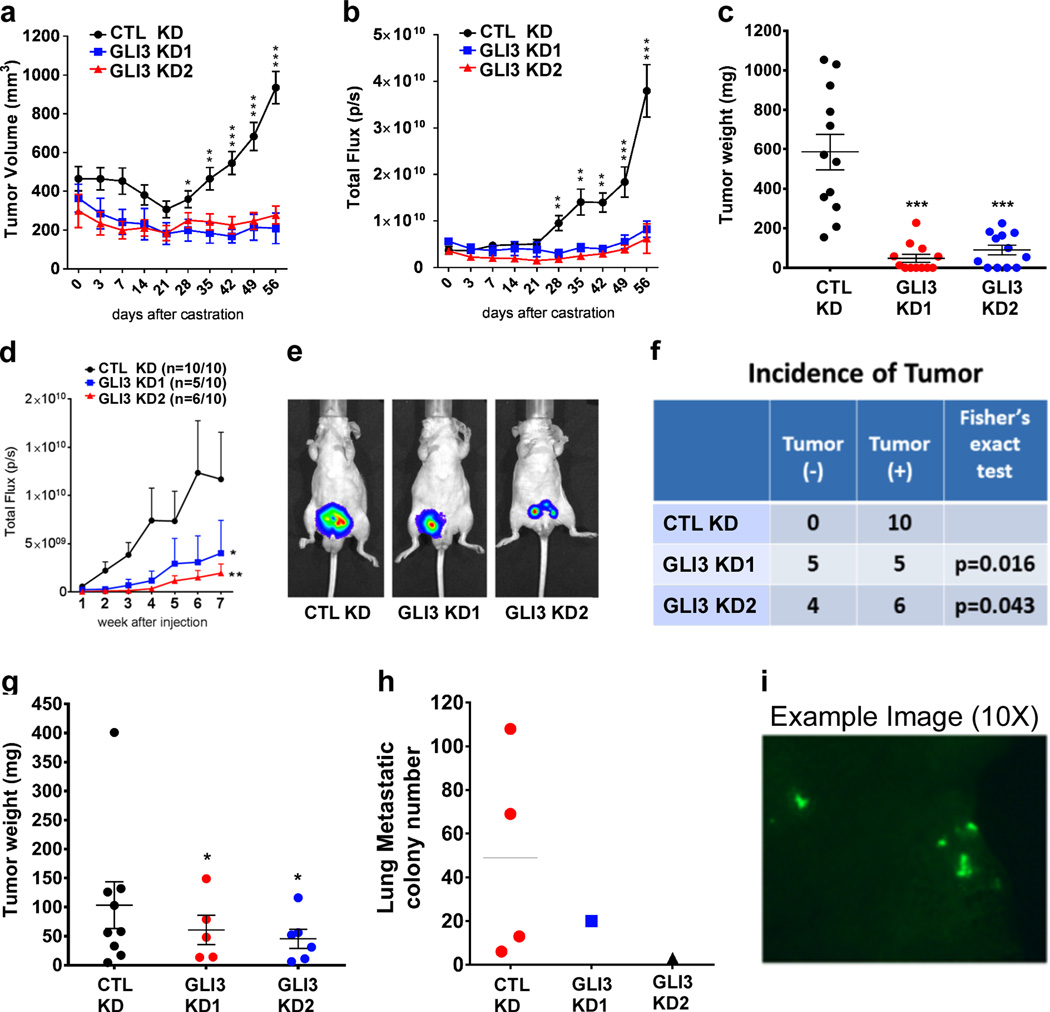
Figure 5. GLI3 signaling supports castration resistant tumor formation.
a-c Subcutaneous tumors were generated by injection of gonadally intact mice with control (CTL KD) or either of 2 GLI3-specific (GLI3 KD1, GLI3 KD2), shRNA-expressing LNCaP cell lines. Once mean volumes in control and GLI3 knockdown tumors reached statistically comparable levels, mice were castrated and castration-resistant tumor growth was measured by tumor volume (a) and total photon flux following bioluminescence imaging (b). Eight weeks post-castration, control and GLI3 knockdown tumors were collected and weighed (c). Each data point in (a and b) represents the mean ± SEM from twelve single tumors. Asterisks denote statistically significant differences vs GLI3 knockdown tumors. In (c) asterisks denote statistically significant differences vs control knockdown tumors (Student’s t-test: *p < 0.05; **p < 0.01; ***p < 0.001). d-i Mice (10 per group) were orthotopically injected with control (CTL KD) or either of 2 GLI3-specific (GLI3 KD1, GLI3 KD2), shRNA-expressing PacMetUT1 cell lines. (d) Tumor growth was monitored for 7 weeks post-inoculation by weekly bioluminescence imaging, and mean total photon flux (± SEM) was plotted for each group of 10 tumors. Asterisks denote statistically significant differences vs control tumors (Mann Whitney test: *p < 0.05; **p < 0.01). (e) Representative bioluminescence image from each group. (f) Comparison of tumor incidence in control versus GLI3 knockdown tumors (Fisher’s exact test, p<0.05). (g) Tumors were collected at 7 weeks post-inoculation and weighed. Data represents the mean ± SEM from single tumors. Asterisks denote statistically significant differences vs control tumors (Student’s t-test: *p < 0.05). (h) Lungs were harvested at 7 weeks post-inoculation and GFP metastatic cancer cell colonies were visualized and counted. (i) Representative fluorescence image of GFP metastatic cancer cell colonies in the lung.

