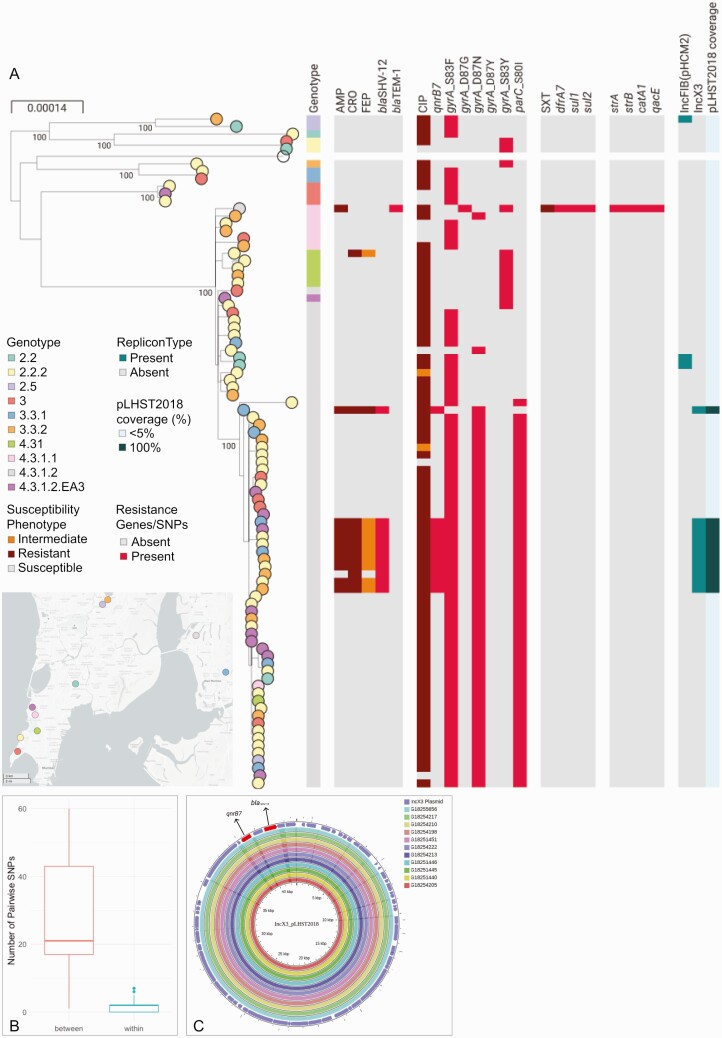
Figure 1.
Analysis of the S. Typhi genomes. A, Phylogenetic tree of 89 genomes with nodes colored by the neighborhood in Mumbai where the patient resided. Maximum-likelihood tree was inferred from 1496 SNP positions identified by mapping the sequence reads to the complete chromosome of strain CT18 (NC_003198) and masking regions corresponding to mobile genetic elements and recombination from the alignment of pseudogenomes. Tree is annotated with the genotype; the susceptibility phenotype to AMP, CRO, FEP, CIP, and SXT; the distribution of resistance genes and mutations conferring resistance to these antibiotics and others not tested; the distribution of plasmid replicon types identified in the genome assemblies with Pathogenwatch; the sequence coverage of the plasmid pLHST2018 determined by mapping sequence reads of each genome to the plasmid sequence. The data are available at https://microreact.org/project/S.Typhi_Mumbai_2017-2018/8713a72b. B, Boxplot showing the distribution of the pairwise SNP differences within the cluster of 10 isolates carrying blaSHV-12 (blue) or between the genomes in this cluster and other 4.3.1.2 genomes not in this cluster (red). The horizontal line indicates the median and the box indicates the interquartile range. C, Comparison of assembly contigs from 11 genomes in this study carrying blaSHV-12, qnrB7 and the IncX3 replicon type to the complete sequence of plasmid pLHST2018. Outermost circle shows the plasmid genes, with resistance genes shown in red. Abbreviations: AMP, ampicillin; CIP, ciprofloxacin; CRO, ceftriaxone; FEP, cefepime; SNP, single nucleotide polymorphism; SXT, sulfamethoxazole-trimethoprim.

