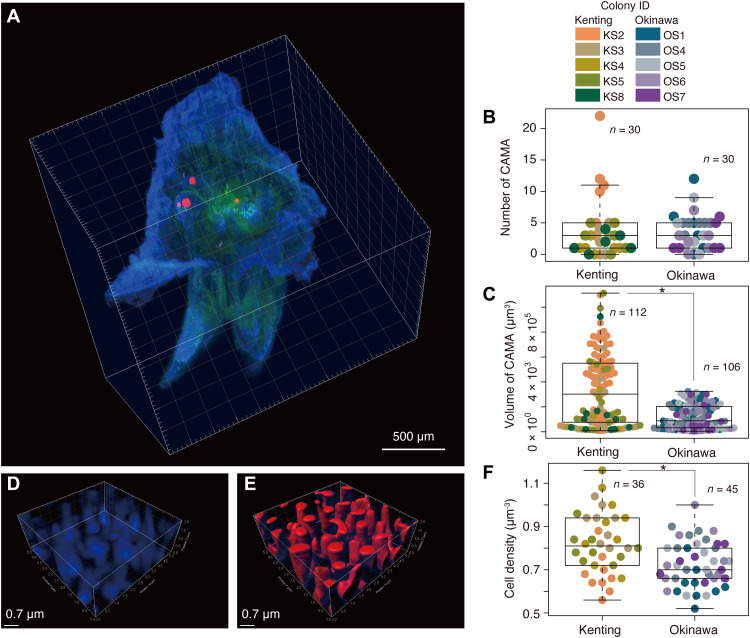
Fig. 1. Estimation of bacterial populations within CAMAs of single coral polyps.
(A) Representative 3D image using a lightsheet microscope demonstrating the localization of four CAMAs in the tentacles of a single polyp, merged with signals from fluorescence in situ hybridization (FISH) with EUB338mix probe (for all bacteria) labeled with Cy3 (red) and autofluorescence of coral tissue (blue) and Symbiodiniaceae (green) using the lightsheet microscope system. Dot plots showing (B) the number of CAMAs and (C) the volume of each CAMA. For estimation of bacterial cell density in single CAMAs, (D) 4′,6-diamidino-2-phenylindole signals (blue) are shown in a 3D image from a confocal microscope and (E) its surface rendering image (red) processing in Imaris software. (F) Dot plot showing the cell density within CAMAs. Asterisks indicate significant differences between Kenting and Okinawa samples (n = 5 colonies each): P = 2.12 × 10⁻⁸, Wilcoxon test (C), and P = 5.12 × 10⁻⁴, t test (F), respectively.

