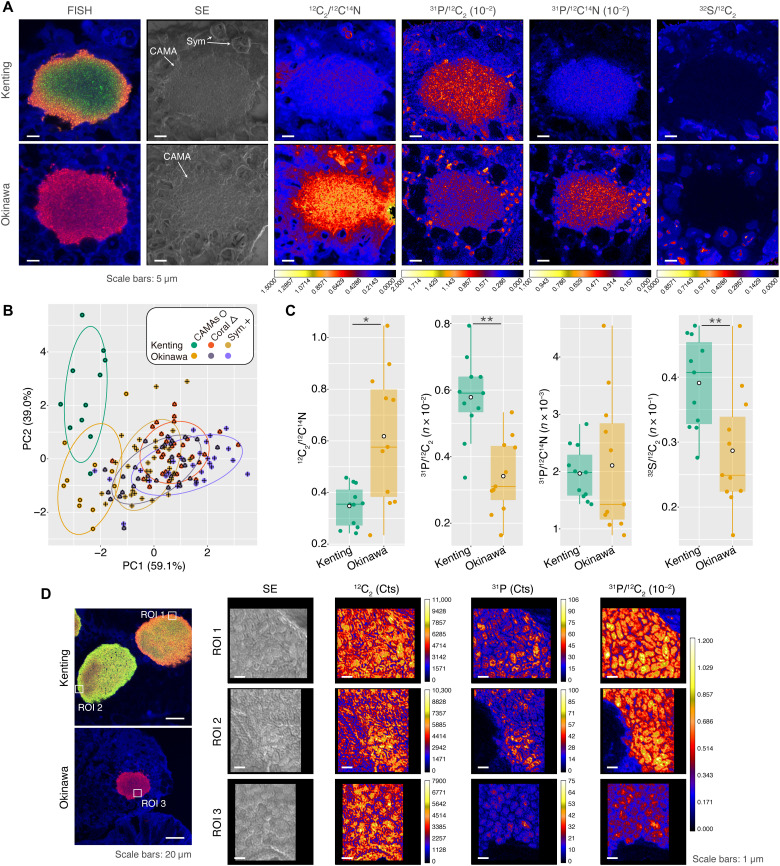
Fig. 6. FISH-NanoSIMS profiling of the natural elemental distribution of CAMAs in coral tissues.
In representative FISH-NanoSIMS images, (A) the confocal merge images representing the signals from FISH [hybridized with Endo-Group A probe (red, Cy3) and Endo-Group B probe (green, Cy5)] and coral autofluorescence (blue). Other columns depicting NanoSIMS ion maps of secondary electron (SE) and the ratios with 12C2/12C14N (C/N), 31P/12C2 (P/C), 31P/12C14N (P/N), and 32S/12C2 (S/C). Sym, Symbiodiniaceae. (B) Biplot of principal components (PC) analysis of natural elemental ratios from three regions: CAMAs (n = 11 CAMAs from both Kenting and Okinawa samples), coral tissues (n = 32 regions from Kenting samples and n = 29 regions from Okinawa samples), and Symbiodiniaceae (n = 33 cells from Kenting samples and n = 28 cells from Okinawa samples). Different colors distinguish points from Kenting and Okinawa and sample types. (C) Dot and box plots representing comparisons within CAMA regions among the ratios C/N, P/C, P/N, and S/C from Kenting and Okinawa samples. Asterisk indicates statistically significant differences (*P < 0.05 and **P < 0.01, Wilcoxon signed-rank test). (D) Representative FISH-NanoSIMS confocal images showing two CAMAs (periphery probe binding and homogeneous types) from Kenting and Okinawa samples. Three regions of interest (ROIs; two regions from Kenting and one region from Okinawa) in FISH images corresponding to NanoSIMS maps of SE, single-element measurement (12C2 and 31P), and P/C ratio.

