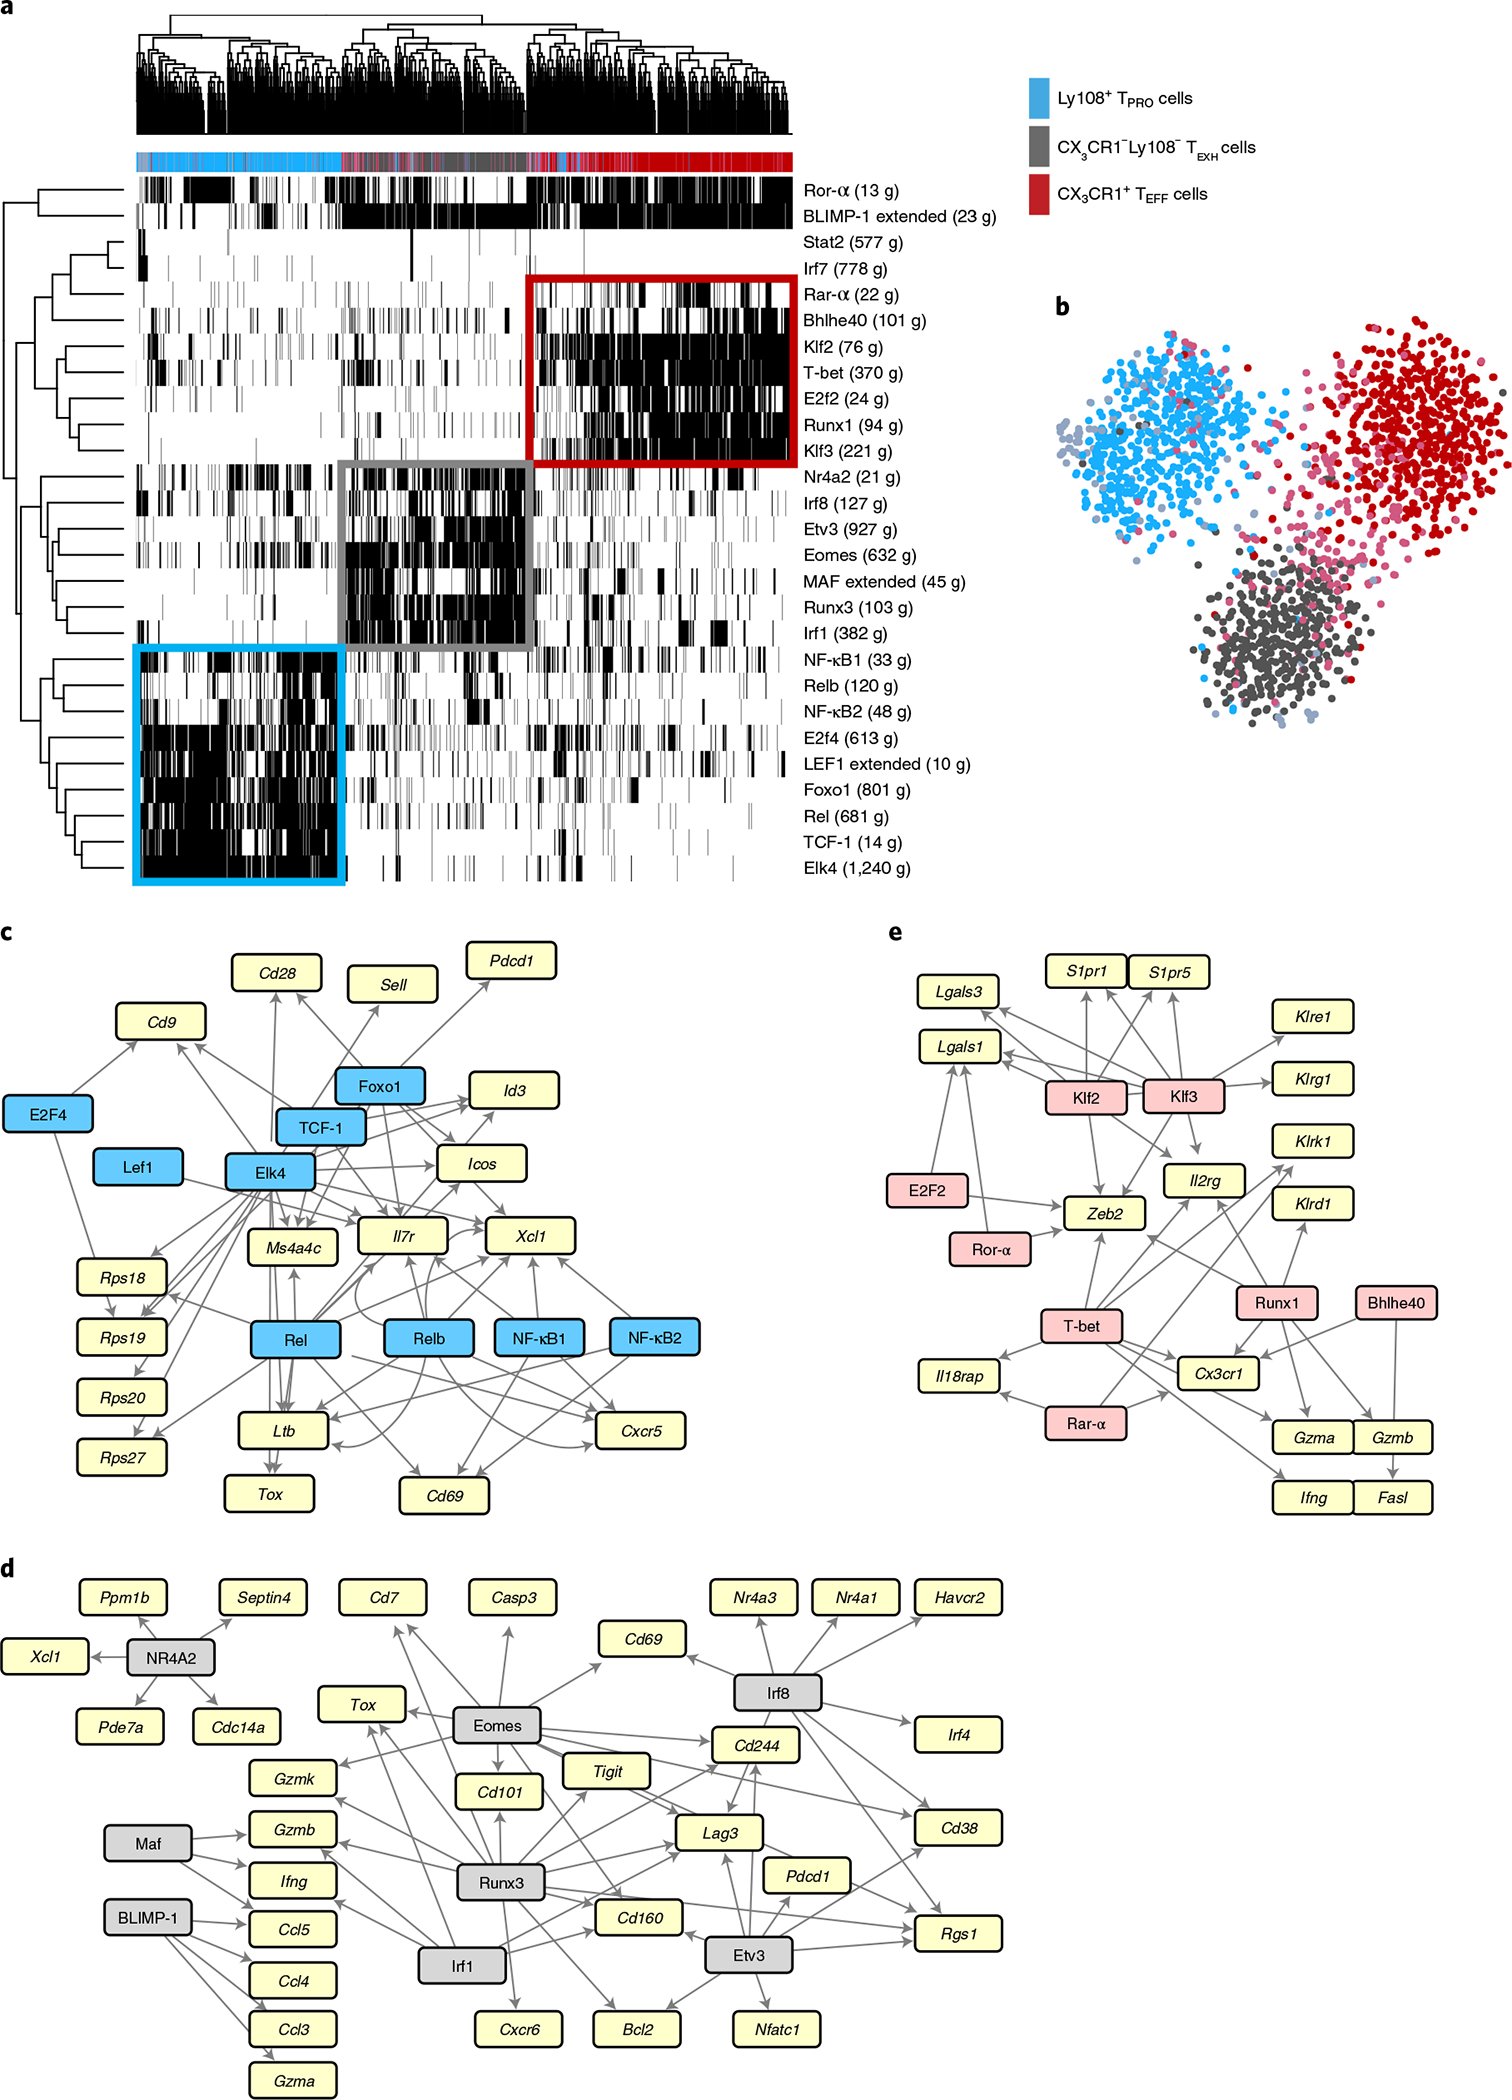
Fig. 1 |. SCENIC analysis revealed distinct transcriptional regulatory circuits for CD8+ T cell subsets during chronic viral infection.

Previously published scRNA-seq data from GP33–41+CD8+ T cells from day 30 p.i. with LCMV Cl13 (GSE129139) were analyzed using SCENIC. a, Heatmap showing binary regulon activities (black, active; white, inactive) of the 27 regulons found in at least 1% of cells that correlated (absolute Pearson correlation >0.30) with that of at least one other regulon. Columns correspond to cells; rows correspond to regulons, with the number of downstream target genes (g) coexpressed with each TF in parentheses. Cells were clustered by regulon activity. The color bar above the heatmap denotes major CD8+ subsets identified by gene expression profiles as previously described8. b, t-distributed stochastic neighbor embedding projection depicting clustering of cells by regulon activity. c–e, GRNs for Ly108+ TPRO cells, CX3CR1−Ly108− TEXH cells and CX3CR1+ TEFF cells. Key TFs for each CD8+ T cell subset are highlighted in blue, pink and gray, respectively. Signature genes for each subset that were identified in our previously published paper are highlighted in yellow. TF–target interactions were visualized by Cytoscape.
