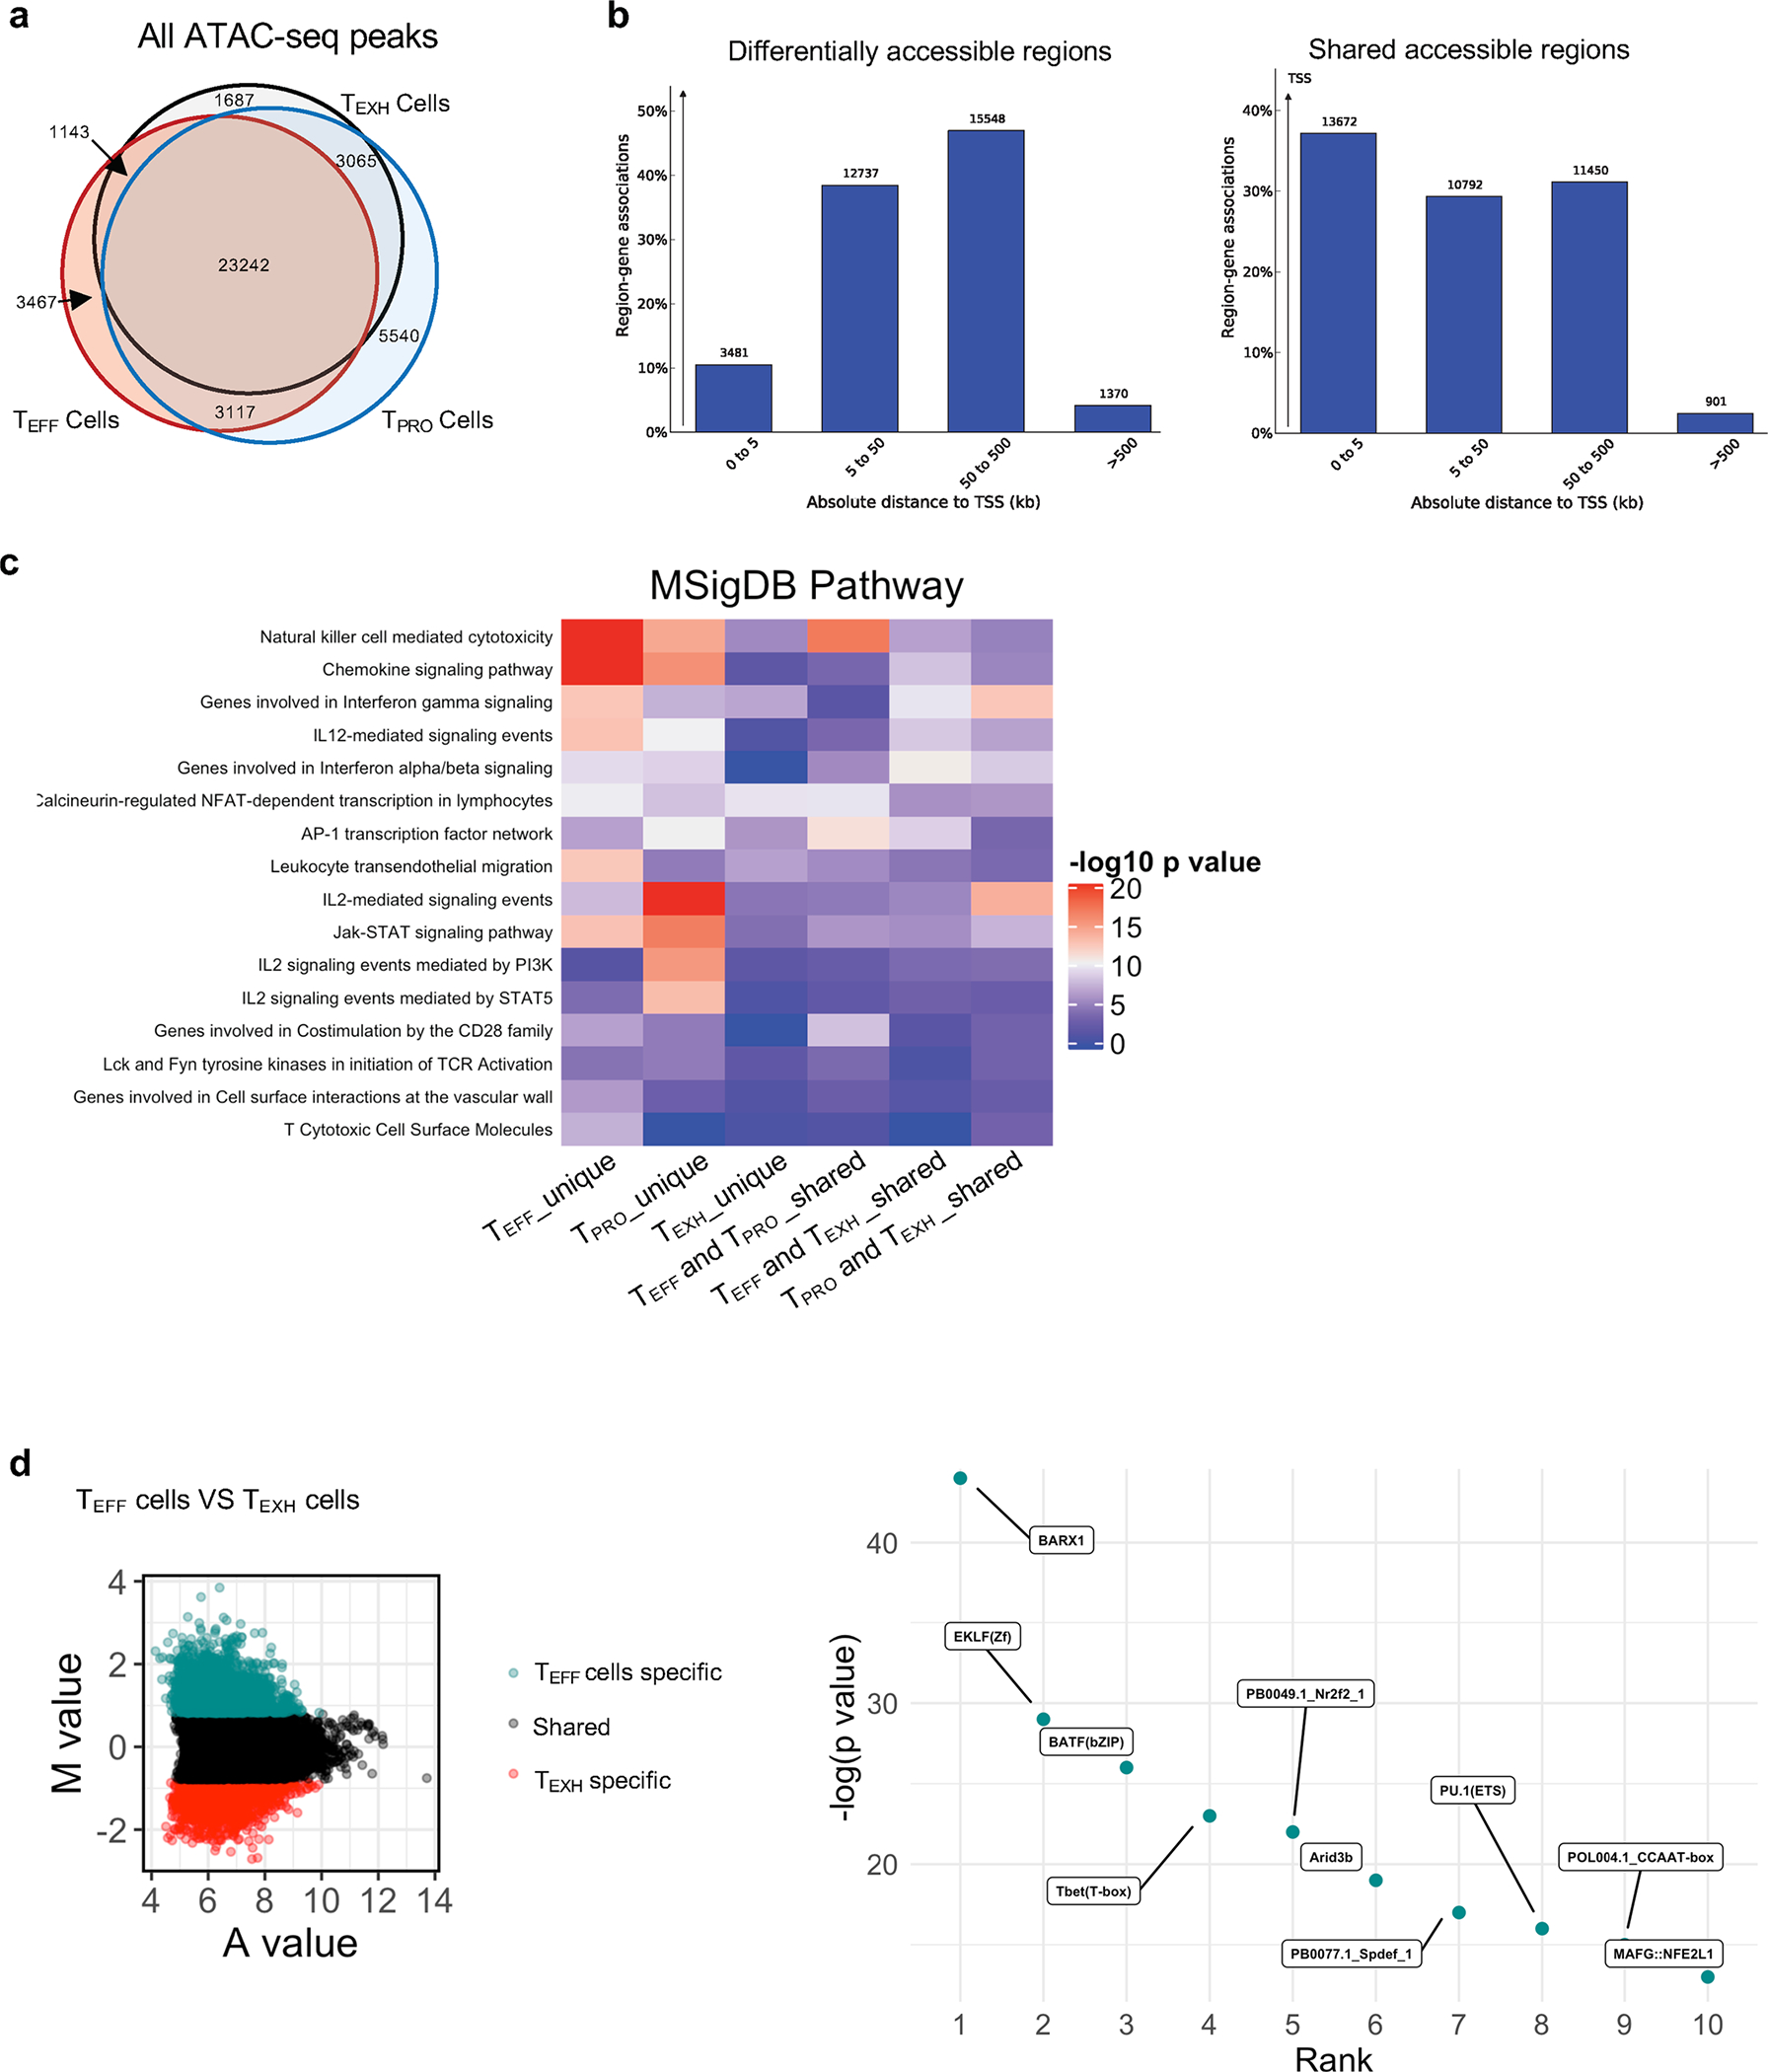
Extended Data Fig. 4 |. Distinct enhancer repertoires regulate transcriptional programs of the three CD8+ T cell subsets.

Venn diagram showing overlap of all chromatin-accessible regions (ChARs) detected by ATAC-seq. b, Bar plot showing the distance of ChARs to TSS. Left are ChARs with differential accessibility among the three CD8+ T cells subsets. Right are ChARs shared by the three subsets. c, Heatmap showing MSigDB pathway enrichment signatures in six enhancer peak sets as shown in Fig. 5c (Top). d, MA plot showing M value vs A value of the merged set of TEFF cell and TEXH cell enhancer peaks after normalization. Top 5,000 peaks are highlighted for TEFF cells (cyan) and TEXH cells (red). Dot plot showing the top 10 TFs whose motifs were significantly enriched in TEFF cell-specific enhancers compared to TEXH cell-specific enhancers.
