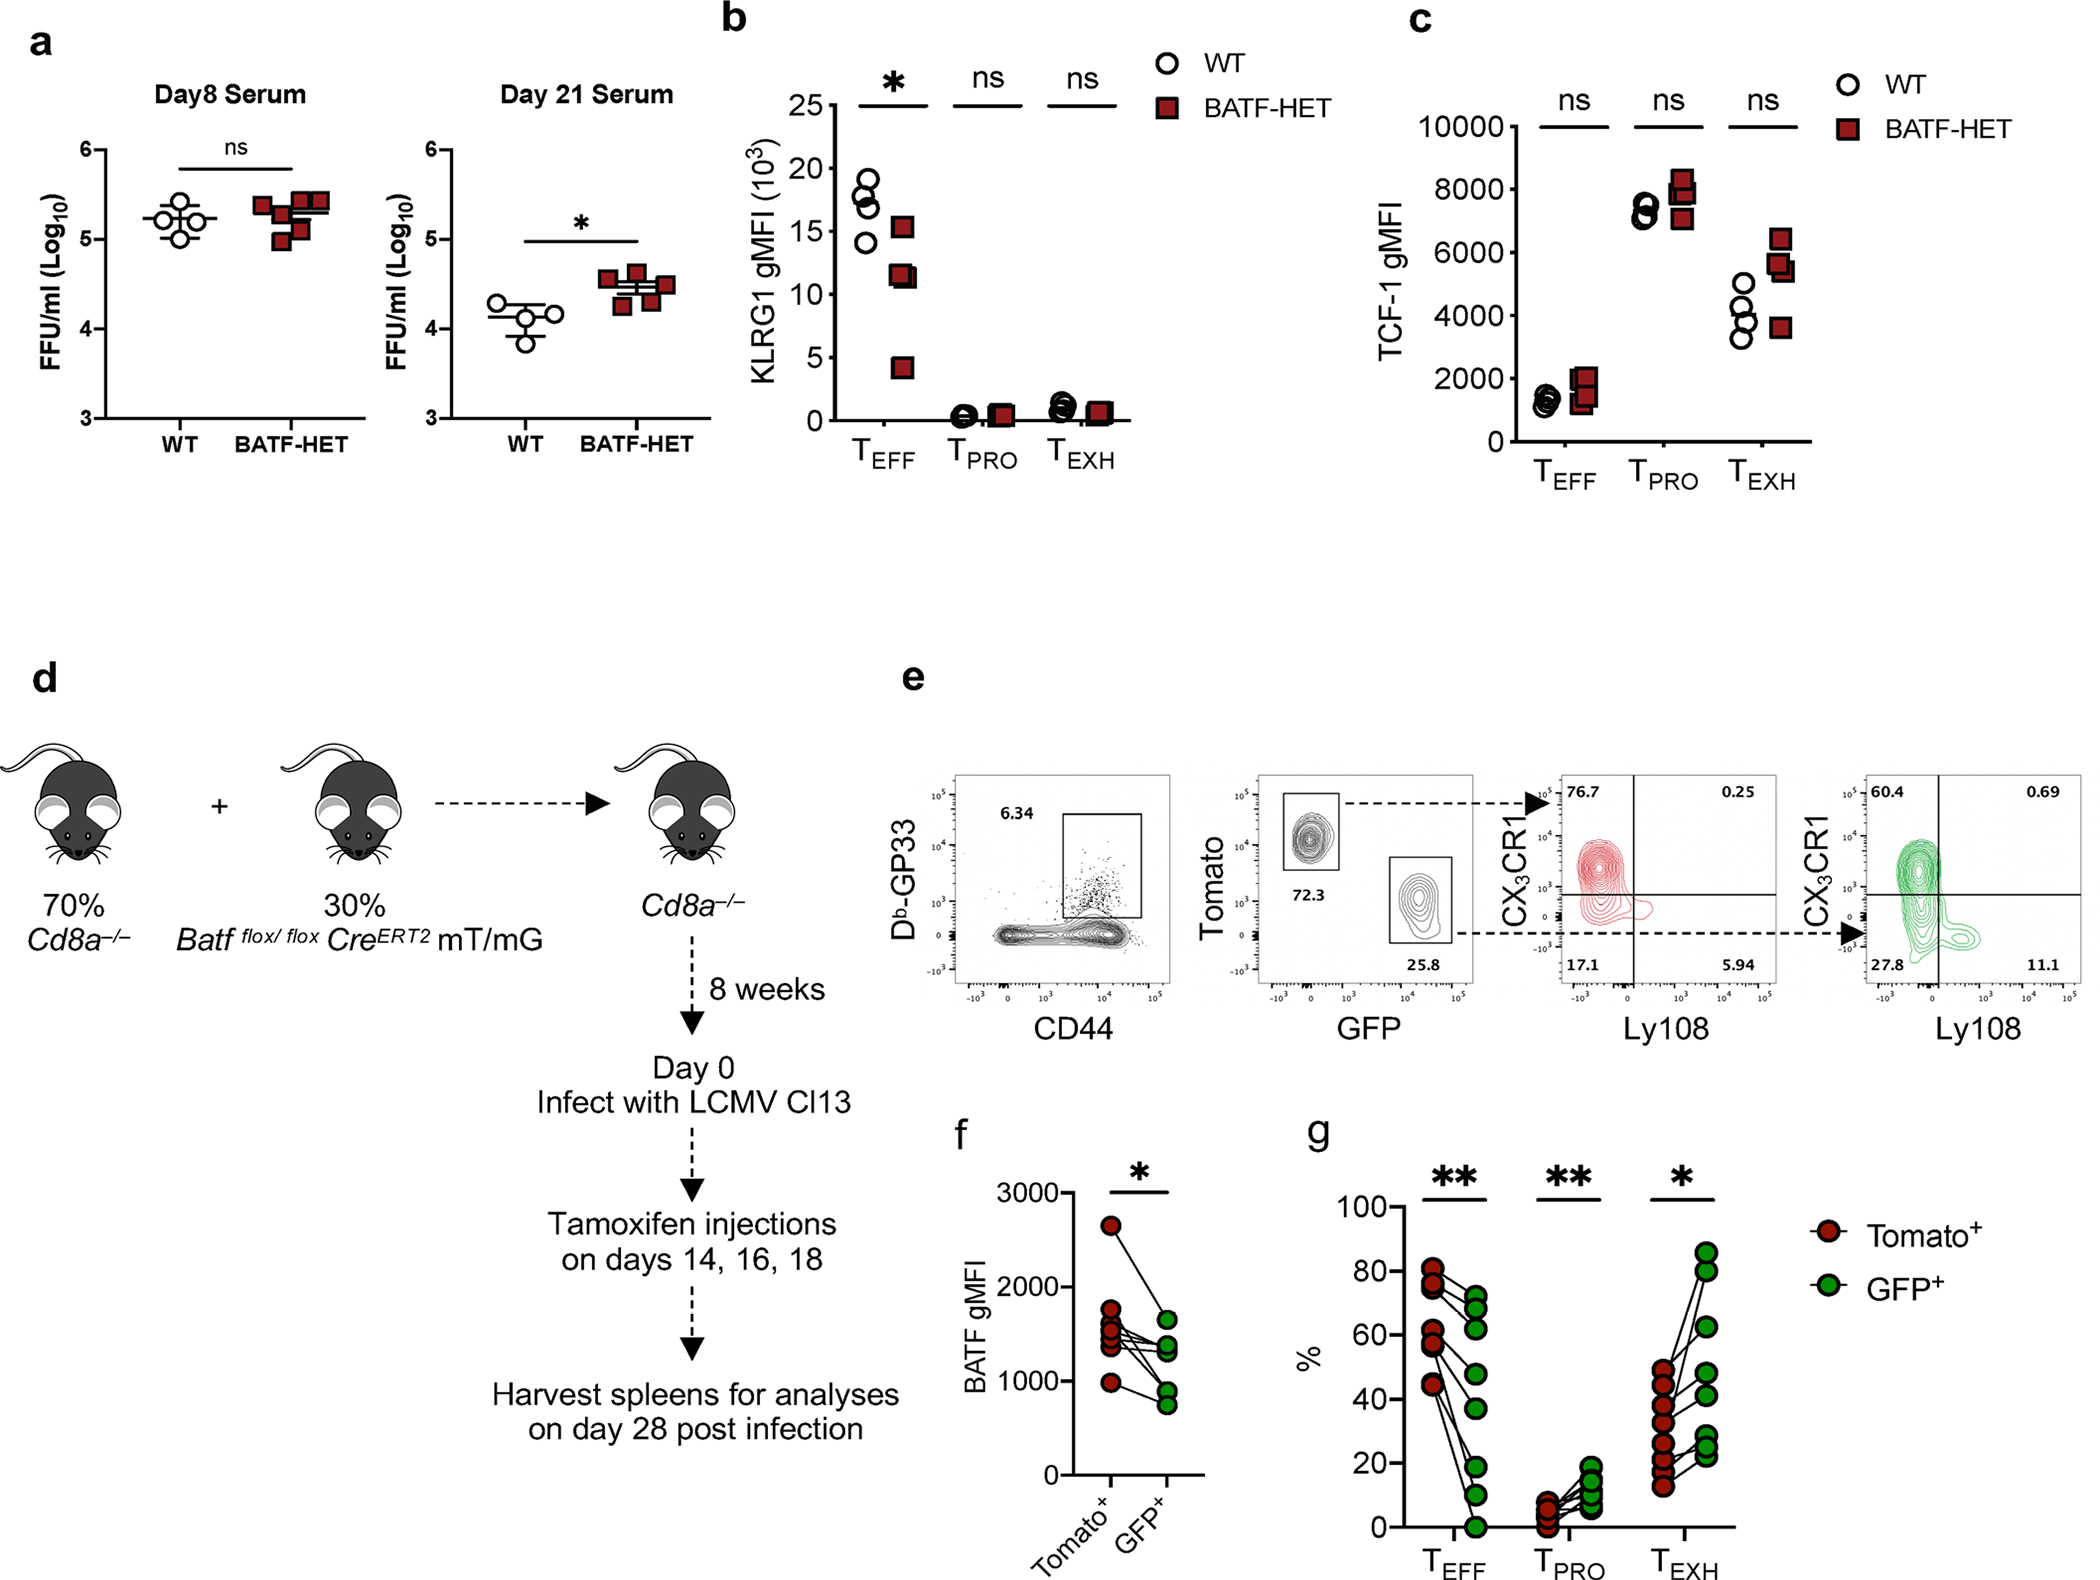
Extended Data Fig. 6 |. BATF is required for TPRO progenitor cell differentiation into TEFF cells.

a, Summary data showing viral titers in the serum of experimental mice on day 8 p.i. and day 30 p.i. b, c, Summary data showing the relative expression of KLRG1 and TCF-1 in three virus-specific CD8+ T cell subsets. d, Experimental design. e, g, Representative flow plots and summary data showing the proportion of three antigen-specific CD8+ T cell subsets in WT and BATF deficient cells on day 28 p.i. with LCMV Cl13. f, Summary data showing the expression of BATF in WT and BATF deficient cells. a, Day 8 data was collected from 4 WT and 6 BATF-HET mice. Day 21 data was collected from 4 WT and 5 BATF-HET mice. b,c, Data was collected from 4 WT and 4 BATF-HET mice. f,g, Data was collected from 8 Batf flox/flox CreERT2 mT/mG mice. c-j, Data pooled from 2 independent experiments. Data are expressed as mean ± s.e.m. ns = not significant, * p < 0.05, ** p < 0.01, *** p < 0.001. a, Two-tailed unpaired t-test. b,c, Unpaired t-test with Holm-Šídák method. f, Two-tailed paired t-test. g, Paired t-test with two-stage step-up method of Benjamini, Krieger, and Yekutieli.
