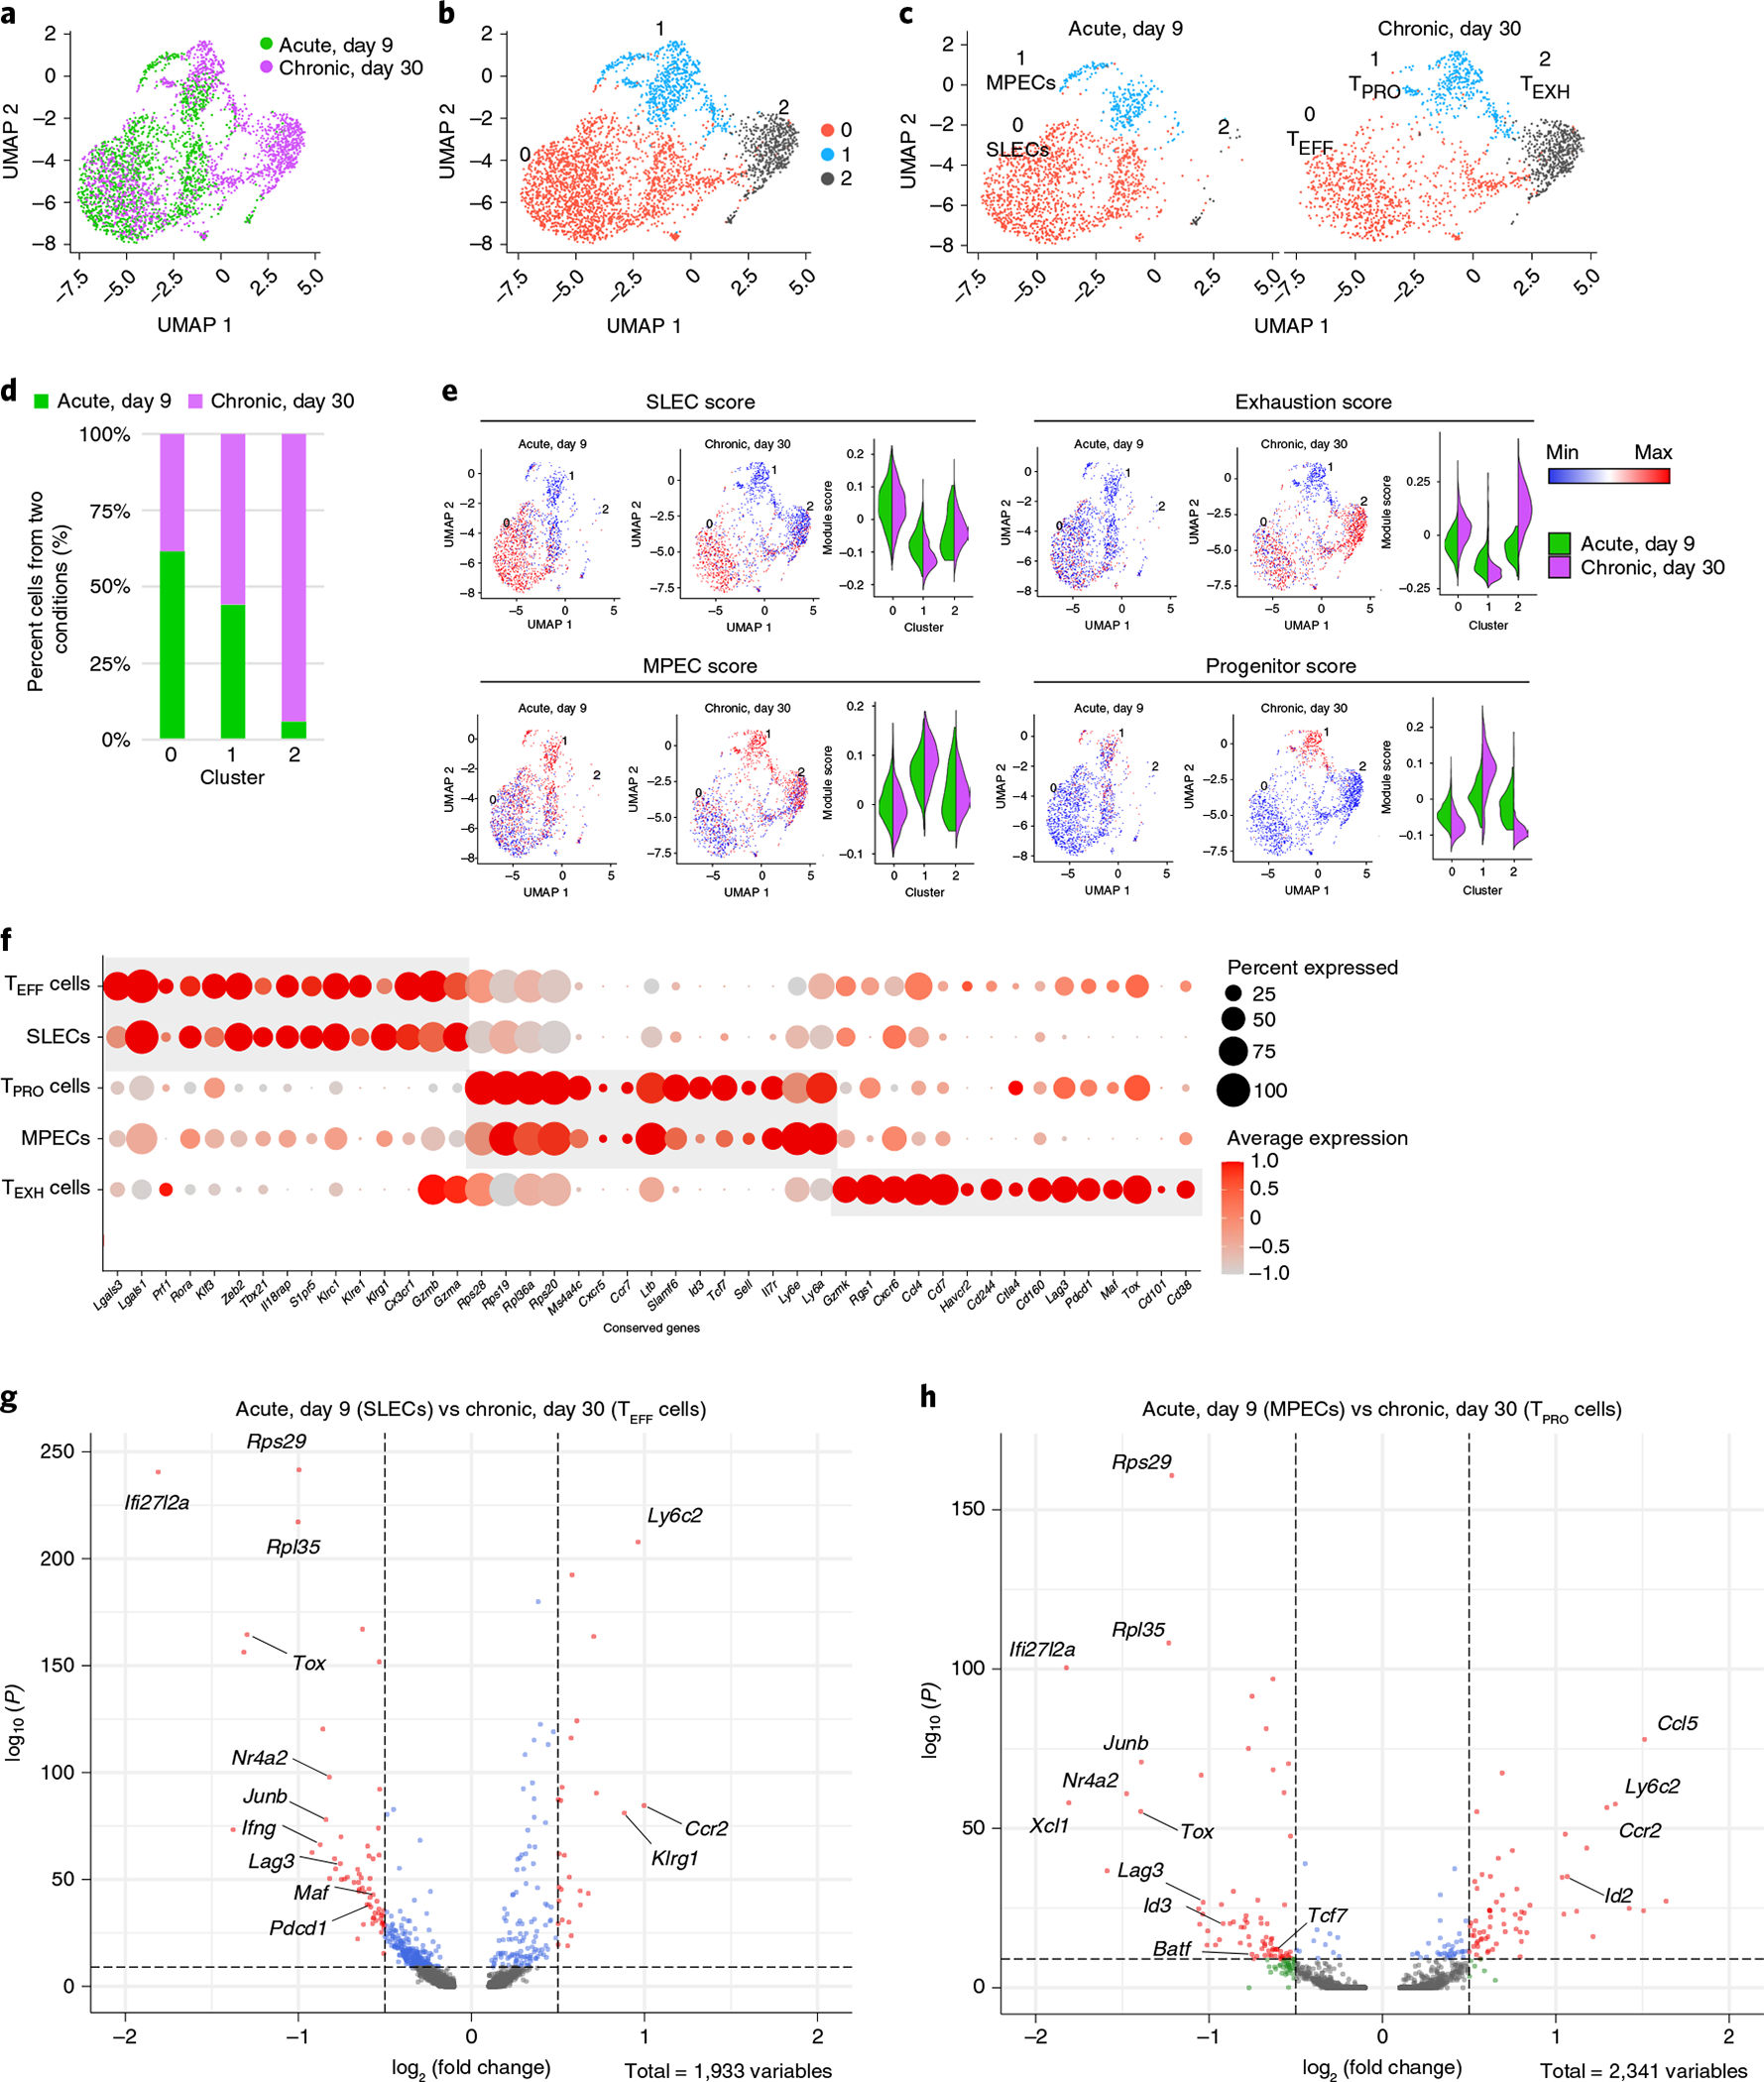
Fig. 2 |. Integrated analysis of single-cell transcriptomes reveals analogous CD8+ subsets arising during acute and chronic viral infections.

a, UMAP plot showing antigen-specific CD8+ T cells from day 9 p.i. with LCMV Armstrong (GSE130130) and day 30 p.i. with LCMV Cl13 (GSE129139) after integrated analysis. b, Unsupervised clustering identified three major clusters in the combined dataset. c, UMAP plots showing cells from different infection conditions. d, The fraction of cells falling into each cluster from different infection conditions. e, Individual cells were scored for enrichment of gene signatures identified in previously published papers (GSE8678, GSE84105). Min, minimum; max, maximum. f, Dot plot of conserved genes across different infection conditions. g,h, Volcano plots showing genes differentially expressed between SLECs and TEFF cells (g) and MPECs and TPRO cells (h).
