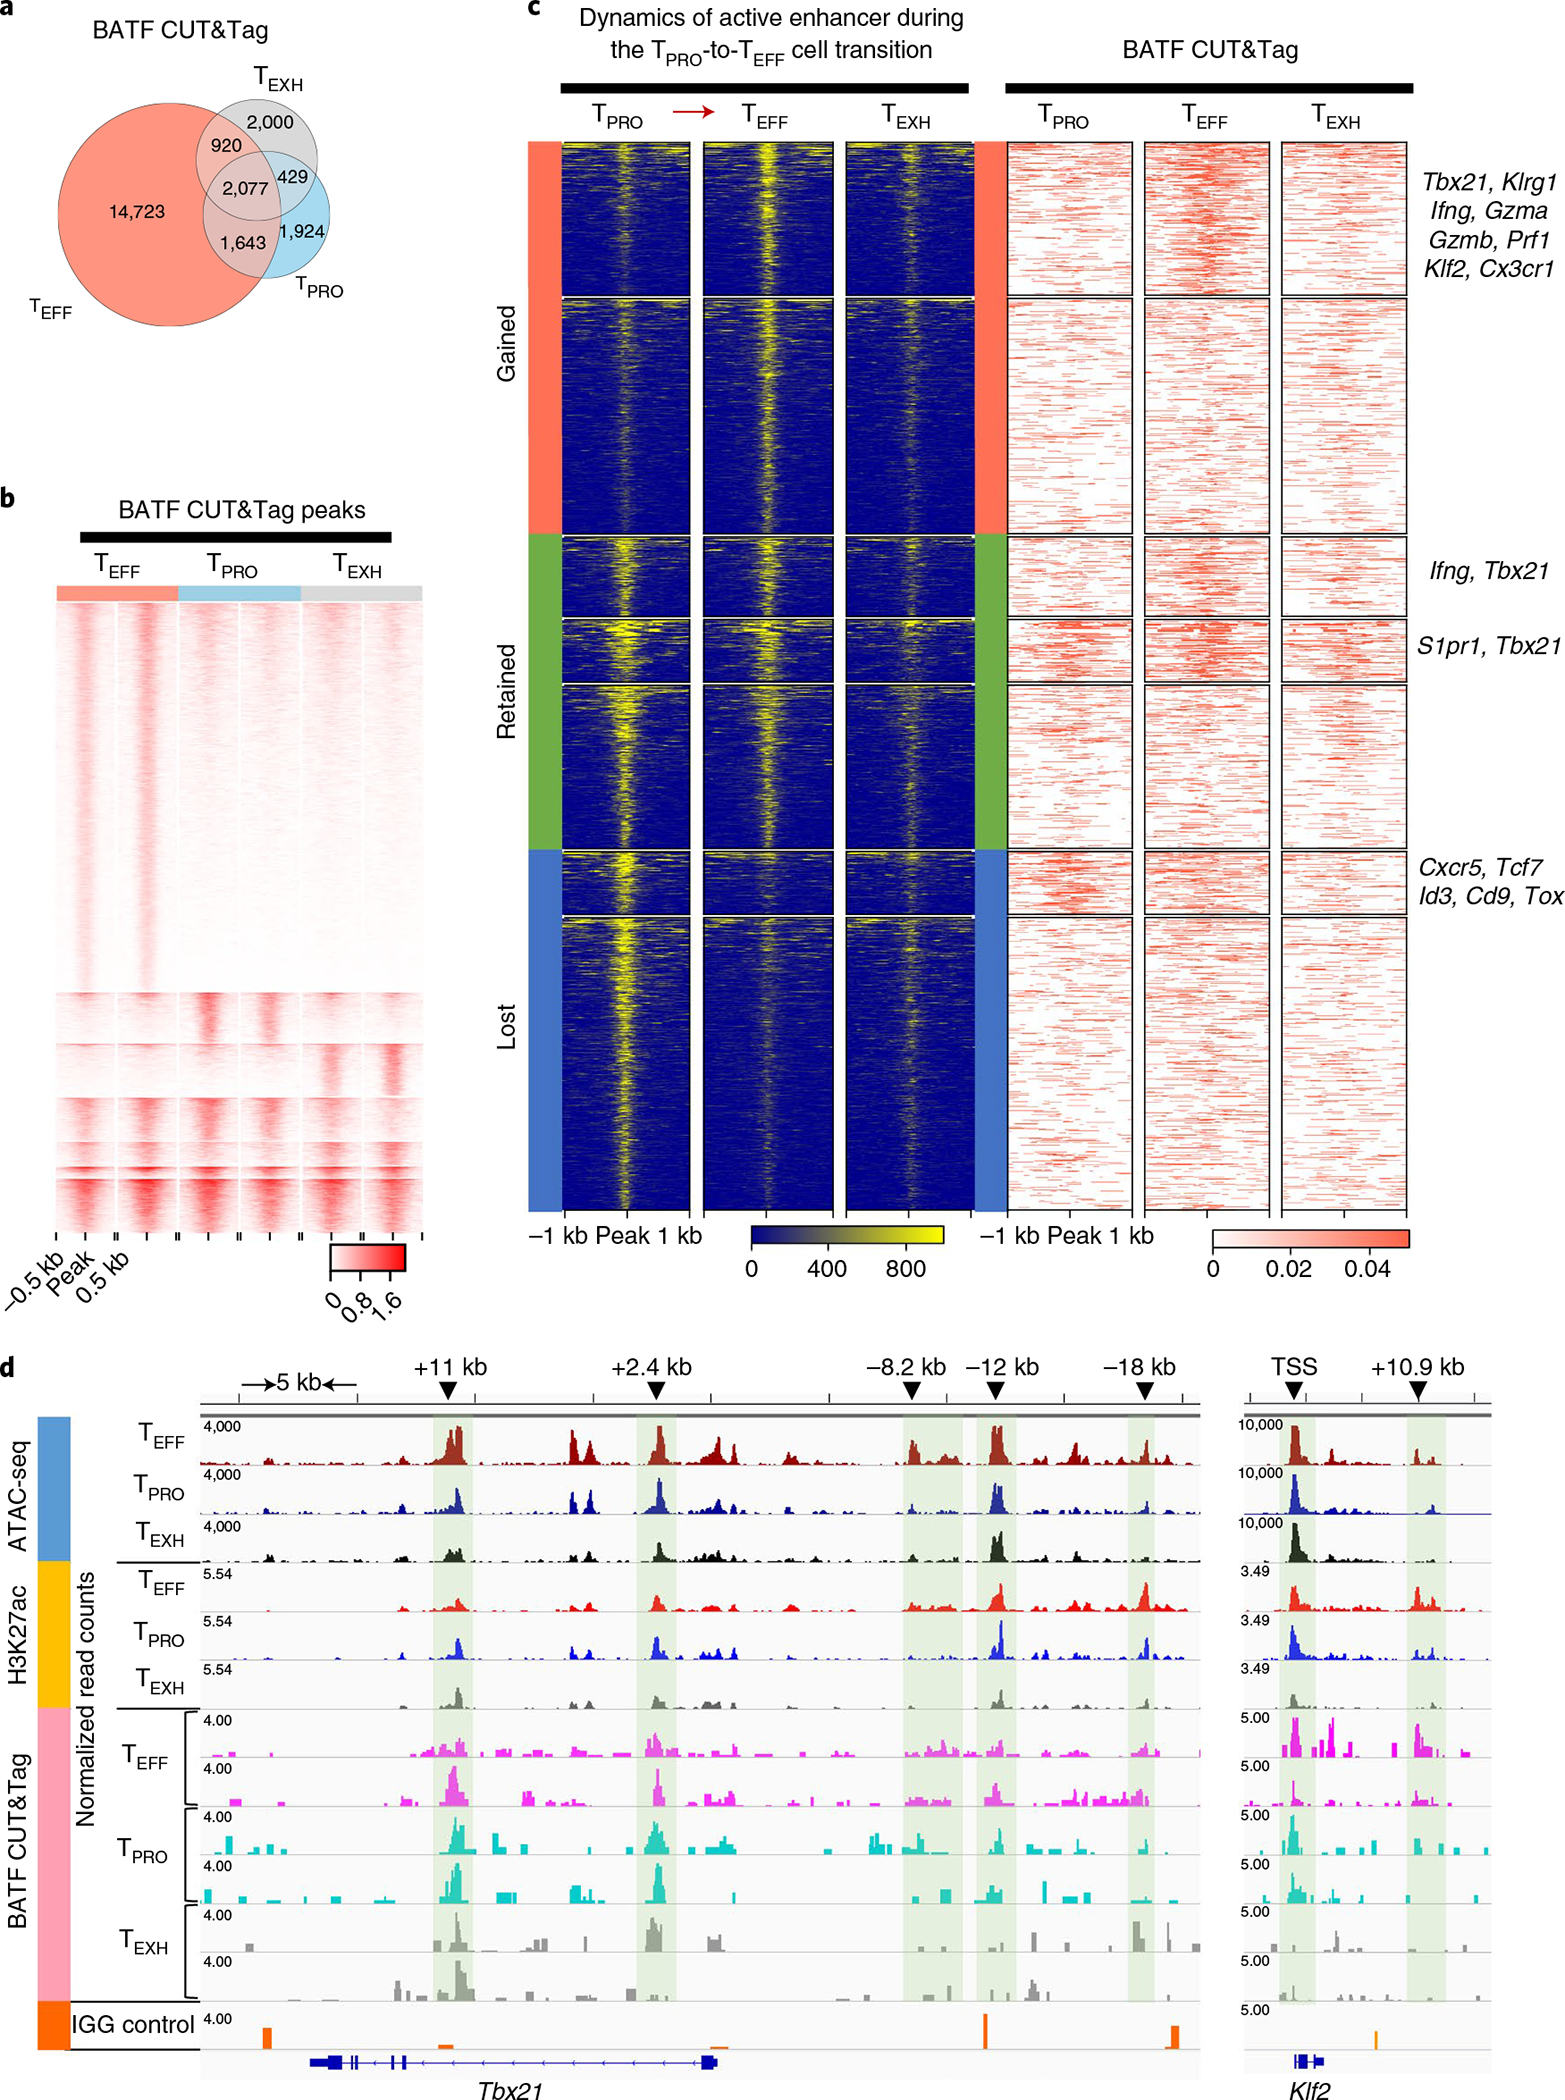
Fig. 7 |. BATF modulates enhancer accessibility to facilitate the TPRO-to-TEFF cell transition.

a,b, Comparison of global BATF CUT&Tag-seq peaks in three virus-specific CD8+ T cell subsets. a, Venn diagram demonstrating numbers of BATF CUT&Tag-seq peaks commonly or differentially present in the three CD8+ T cell subsets. b, Heatmap showing signal intensity (reads per 50 bp) of each BATF CUT&Tag-seq peak. k-means clustering in seqMINER was used to group the BATF CUT&Tag-seq peaks based on their signal intensities (linear normalization method). c, Left, dynamics of active enhancers (ATAC+H3K27ac+) during the TPRO-to-TEFF cell transition. Active enhancers were grouped into three categories based on their presence in TPRO cells and TEFF cells. Right, occupancy of BATF at these active enhancers. BATF-bound active enhancers were annotated to nearby genes using HOMER annotatePeaks. Representative genes in each group are listed on the right. d, Genome track view of the Tbx21 locus showing ATAC-seq, H3K27ac and BATF CUT&Tag peaks in TPRO cells, TEFF cells and TEXH cells. TFs with predictive binding sites at the enhancers (green shadows) are listed. For ATAC-seq data, the scale bar represents RPKM values. For BATF CUT&Tag-seq data, the scale bar represents Escherichia coli DNA–normalized read counts. BATF CUT&Tag-seq data are from three independent replicates. Each replicate was pooled together from two to three mice.
