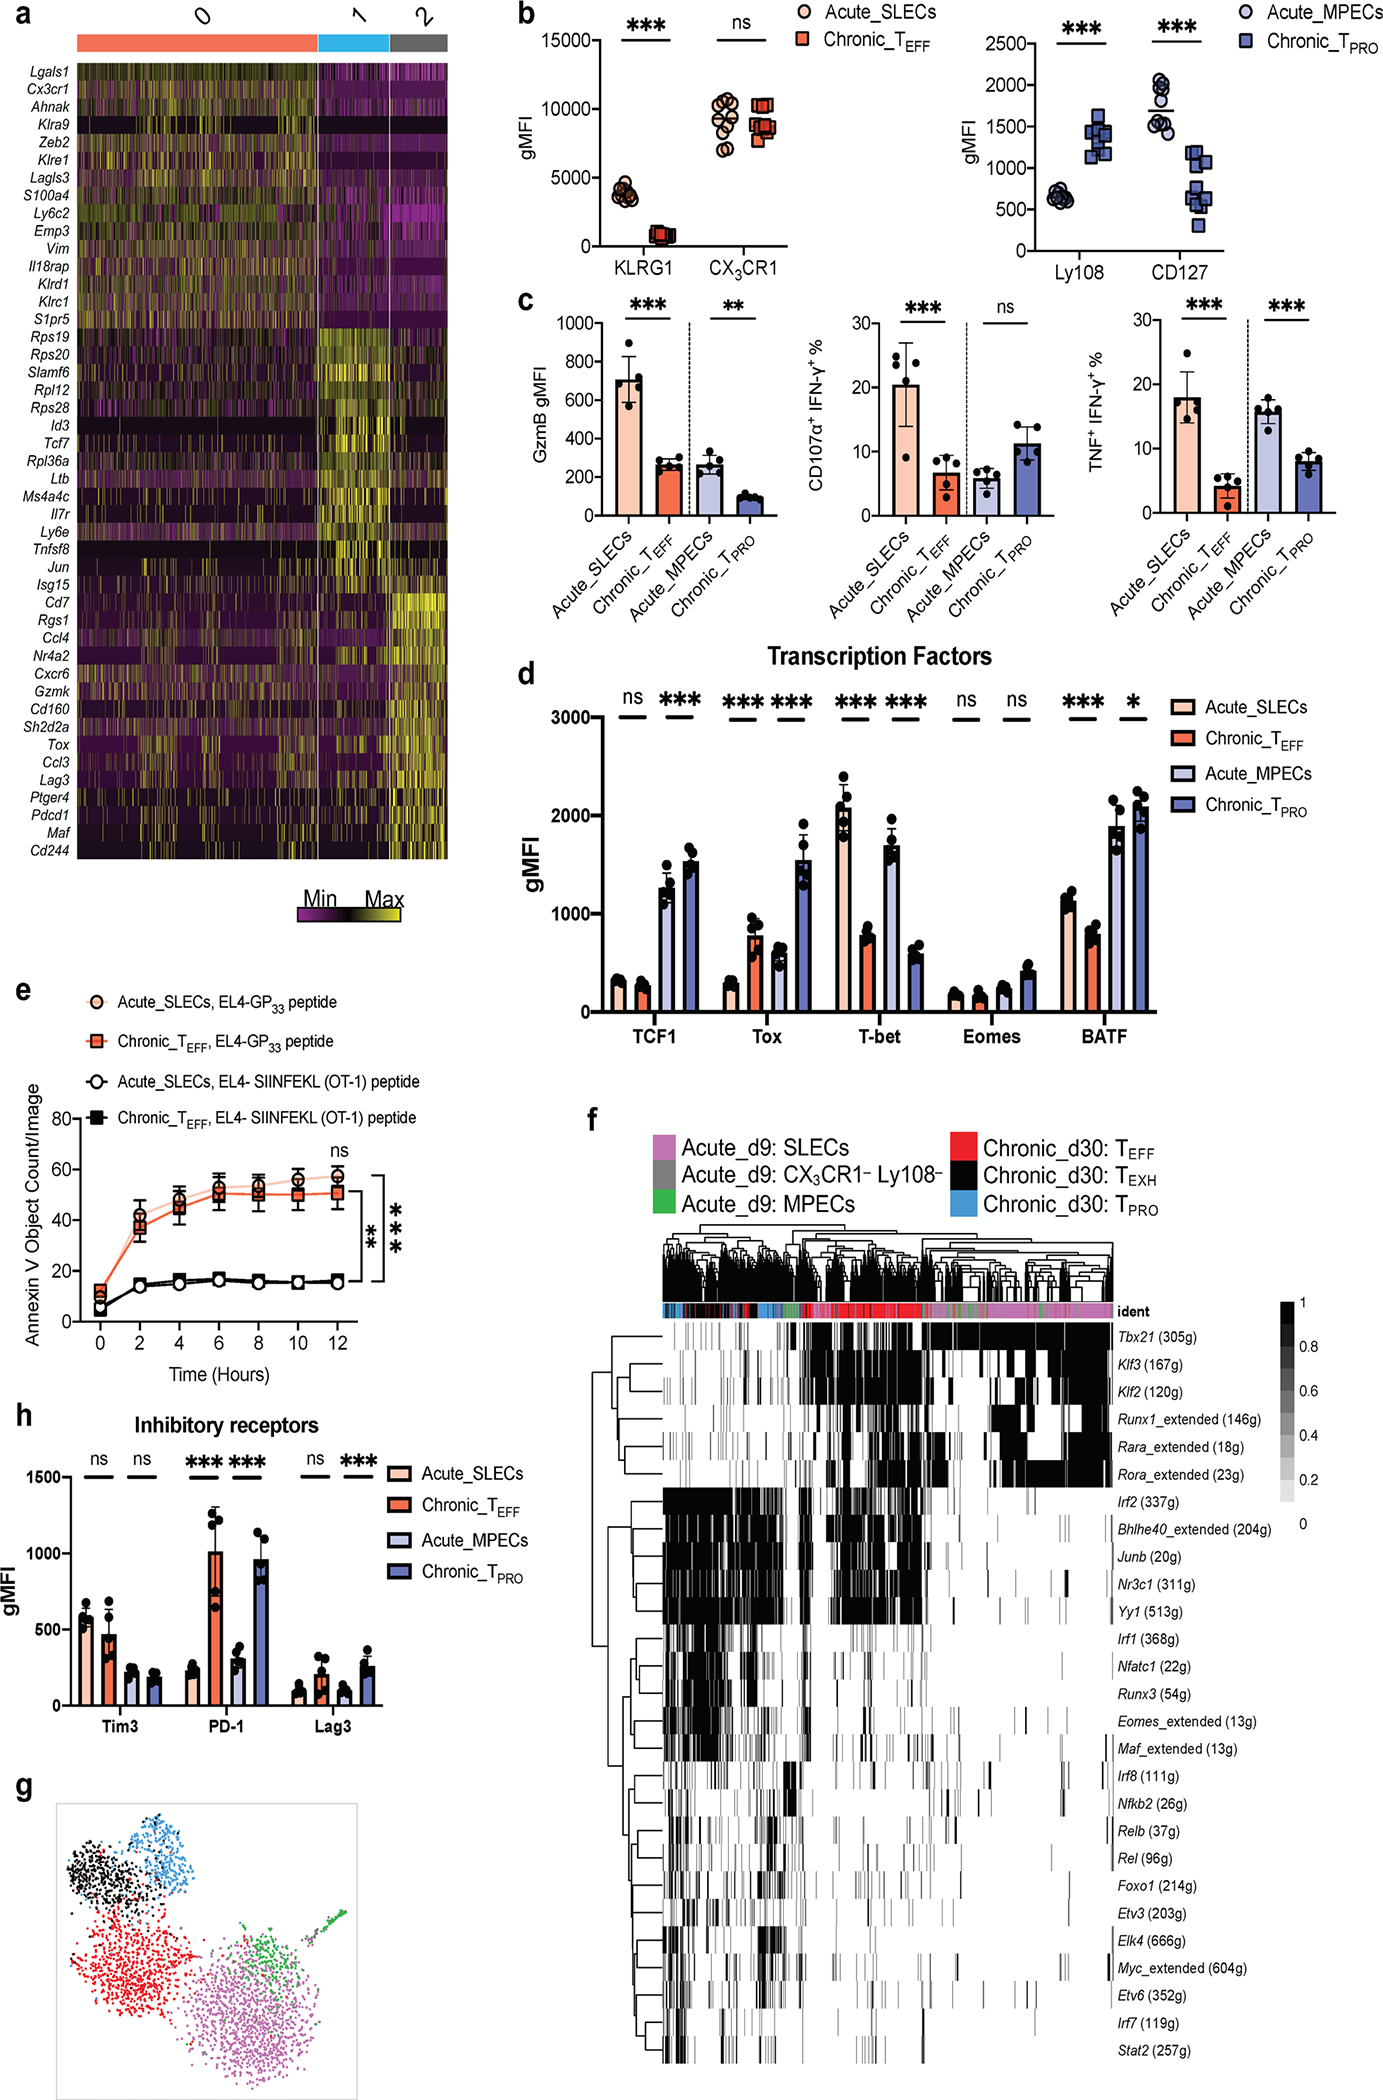
Extended Data Fig. 2 |. Unsupervised clustering analysis identified three major cell populations in the integrated dataset.

a, Heatmap showing the top 15 differentially expressed genes for each cluster as defined in Fig. 2b. Columns and rows correspond to cells and genes, respectively. Cells from the same cluster are grouped together. The color scale representing Z-Score that is generated from log2 read counts. b,c,d,e,h, Showing the comparison of CD8 T cells from day 9 post-acute infection and day 30 post-chronic infection. Cells are gated on CD8+CD44+ GP33–41+ cells. b, left. Summary data showing the expression of surface makers for SLECs and TEFF cells. b, right. Summary data showing the expression of surface makers for MPECs and TPRO cells. c, Summary data showing the expression of GzmB, proportion of CD8+ T cell degranulating (CD107a+) and producing IFN-γ, and proportion of CD8+ T cell producing TNF and IFN-γ upon ex vivo stimulation with GP33–41 peptide. d,h, Summary data showing the expression of transcription factors and inhibitory receptors. e, Summary data showing the relative cytotoxicity of SLECs and TEFF cells against peptide-pulsed target cells. f, Heatmap showing binary regulon activities of CD8 T cells from day 9 post-acute infection and day 30 post-chronic infection. g, t-SNE projection depicting clustering of cells by regulon activity. b, 10 mice for acute infection and 10 mice for chronic infection. c,d,h, 5 mice for acute infection and 5 mice for chronic infection. e, 10 mice for acute infection and 7 mice for chronic infection. b-h, Data pooled from 2 independent experiments. Data are expressed as mean ± s.e.m. ns = not significant, * p < 0.05, ** p < 0.01, *** p < 0.001. b, Unpaired t-test with two-stage step-up method of Benjamini, Krieger, and Yekutieli. c,d,e,h, Ordinary one-way ANOVA.
