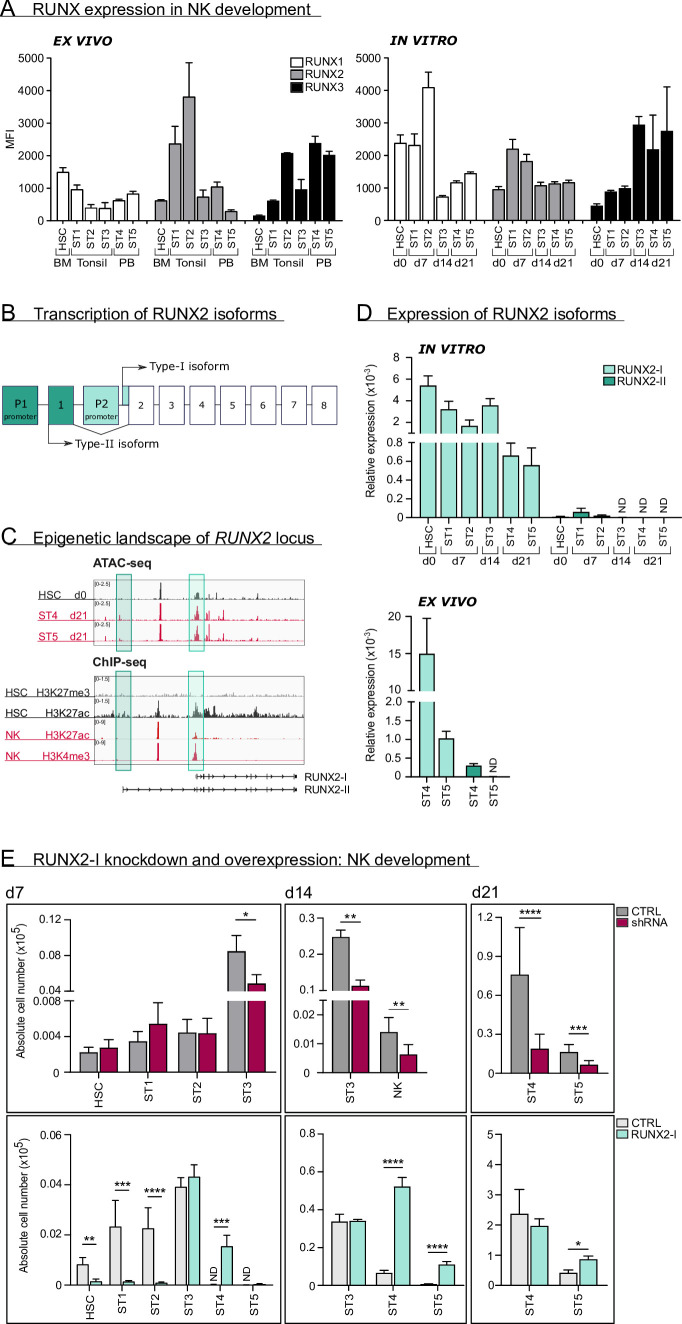
Figure 1. RUNX2-I is predominantly expressed and plays an important role in natural killer (NK) cell development.
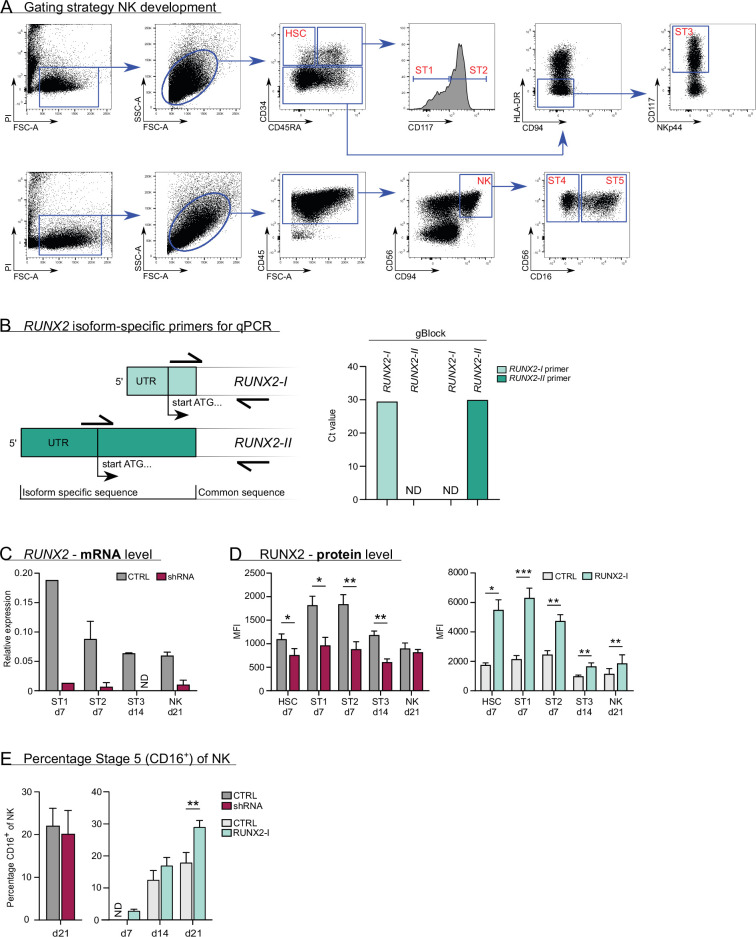
(A) RUNX1, RUNX2, and RUNX3 expression were evaluated in ex vivo and in vitro NK cell developmental stages with flow cytometry and presented as mean fluorescence intensity (MFI). For ex vivo data, haematopoietic stem cells (HSC; CD34+CD45RA−) originated from bone marrow, stage 1 (CD34+CD45RA+CD117−), stage 2 (CD34+CD45RA−CD117+), and stage 3 (CD34−CD117+CD94−HLA-DR−NKp44−) progenitors from tonsil, and stage 4 (CD56+CD94+CD16−) and stage 5 (CD56+CD94+CD16+) NK cells from peripheral blood (mean ± SEM; n=2–4). In vitro expression levels were determined in equivalent stages from cord blood (CB) HSC-based NK cell differentiation cultures at indicated time points (mean ± SEM; n=6). (B) Schematic overview of the transcriptional regulation of the RUNX2 principal isoforms. The type II isoform (RUNX2-II, eight exons) is transcribed from distal promoter P1, while the type I isoform (RUNX2-I, seven exons) is regulated by proximal promoter P2. (C) Genome browser tracks of RUNX2 locus obtained from publicly available ATAC-seq data from HSC (d0), stages 4 and 5 NK cells (d21) of in vitro differentiation cultures (top panel) and histone ChIP-seq data from CB HSC (H3K27me3 and H2K27ac) and PB NK cells (H3K27ac and H3K4me3). The highlighted regions emphasise the promoter regions of the two RUNX2 isoforms. (D) Relative expression of the RUNX2 isoforms was measured in the indicated in vitro NK cell developmental stages and in ex vivo stages 4 and 5 PB NK cells using quantitative PCR (mean ± SEM; n=2–3). (E) CB-derived CD34+ HSC were transduced with either a lentiviral vector containing a RUNX2-specific shRNA or a retroviral vector with the RUNX2-I isoform cDNA. A lentiviral vector containing scrambled shRNA and an empty retroviral vector were negative controls. Transduced eGFP+ HSC (Lin−CD34+CD45RA−) were sorted and cultured in NK cell-specific differentiation conditions. Absolute cell numbers of indicated NK cell developmental stages in RUNX2(-I) knockdown and overexpression differentiation cultures were determined using flow cytometry at the indicated time points (mean ± SEM; n=4–12). Statistical significance was determined using the paired Student's t-test. *, **, ***, and **** represent statistical significance compared to control-transduced cultures with p<0.05, p<0.01, p<0.001, and p<0.0001, respectively. ND, not detectable.


