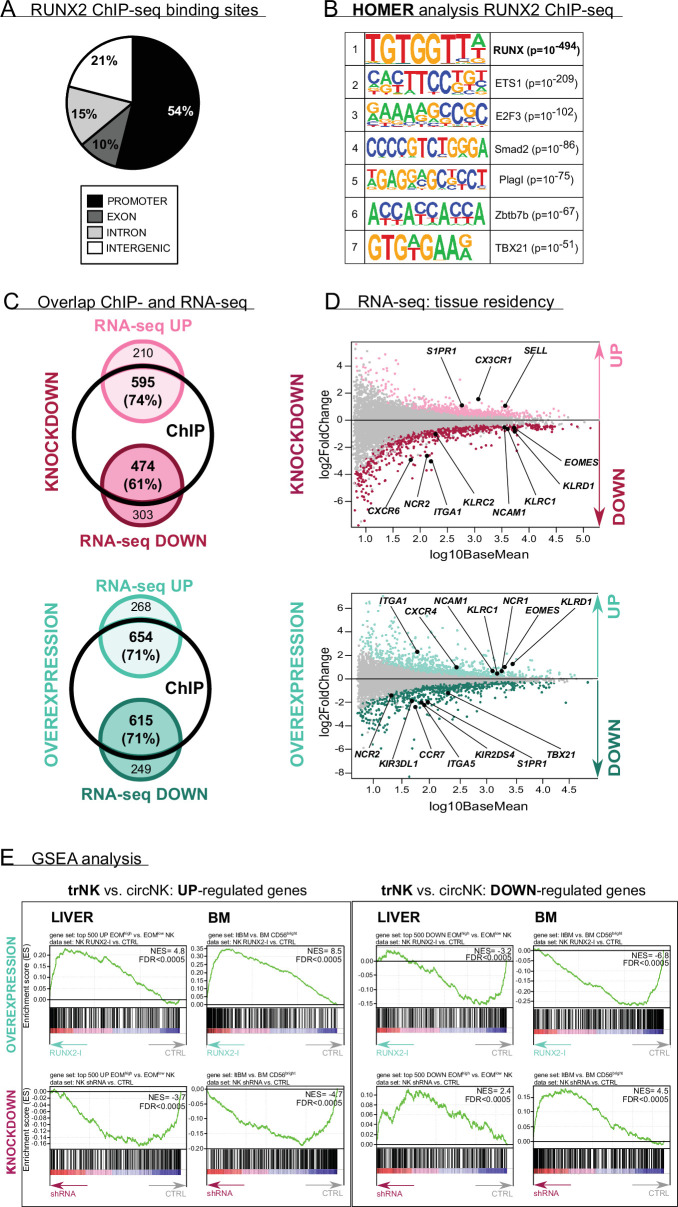
Figure 3. RUNX2 regulates a tissue residency transcriptional program.
(A–B) RUNX2 ChIP-seq analysis was performed on sorted human PB natural killer (NK) cells. (A) Locations of RUNX2 ChIP peaks relative to genomic annotations. (B) The top 7 motifs obtained from the HOMER motif enrichment analysis of the RUNX2 ChIP-seq are depicted. (C–E) NK cells from RUNX2(-I) knockdown and overexpression cultures were sorted, and the transcriptome was analysed using RNA-sequencing (n=4–5). (C) The Venn diagrams show the overlap between ChIP-seq and the indicated RNA-seq analysis. The majority of the significantly up- (‘UP’) or downregulated (‘DOWN’) genes in both the knockdown and overexpression cultures were directly targeted by RUNX2. (D) MA plots displaying down- and upregulated genes in NK cells from RUNX2(-I) knockdown (top panel) and overexpression cultures (bottom panel). Tissue residency-associated genes are depicted. (E) Gene Set Enrichment Analysis (GSEA). The gene sets were obtained from studies comparing tissue-resident (trNK) and recirculating (circNK) NK cells in the liver (top 500 up- and downregulated genes; Cuff et al., 2016) or bone marrow (Melsen et al., 2018). Up- and downregulated genes in tissue-resident versus recirculating NK cell subsets are presented in the left and right box, respectively. The datasets were obtained by RNA-seq analysis of NK cells from RUNX2(-I) overexpression (top row) and knockdown cultures (bottom row).

