. 2022 Jun 24;11:e77614. doi: 10.7554/eLife.77614

Figure 5. Complement system signalling regulates osteoblast cell shape changes and migration in vivo.

(A) RNAscope in situ detection of c5aR1 expression in bglap expressing osteoblasts in a non-injured fin segment. YZ section shows localisation of both RNAs in the same cell layer. Scale bar, 10 µm. (B) Expression of complement factors detected by qRT-PCR in the liver, fins at 0 hpa and 6 hpa. Plotted are the ΔΔCT values relative to the 0 hpa fins. Each data point represents one biological replicate. Error bars represent SD. Two-way ANOVA. (C) Osteoblast roundness at 1 day post amputation (dpa). The C5aR1 inhibitor W54011 does not alter osteoblast cell shape in segments –3 and –2, but cell elongation in segment –1 is inhibited. N (experiments)=3, n (fins)=5, n (rays)=5, n (cells)=116. Error bars represent 95% CI. Kruskal-Wallis test. (D) Osteoblast roundness at 1 dpa. The C3R inhibitor SB290157 does not alter osteoblast cell shape in segments –3 and –2, but cell elongation in segment –1 is inhibited. N (experiments)=1, n (fins)=5, n (rays)=5, n (cells)=38. Error bars represent 95% CI. Kruskal-Wallis test. (E) Inhibition of C5aR1 with either W54011 or PMX205, and inhibition of C3aR with SB290157 impairs bulk osteoblast migration. Images show overlay of 0 dpa (green) and 1 dpa (pink) pictures. N (experiments)=3, W54011: n (fins)=27, n (rays)=54; PMX-205, SB290157: n (fins)=29, n (rays)=58. Error bars represent 95% CI. Mann-Whitney tests. Scale bar, 100 µm. (F) Neither inhibition of C5aR1 (W54011, PMX205) nor of C3aR (SB290157) affects osteoblast dedifferentiation measured as bglap RNAscope intensity at 1 dpa in segment –1 relative to the intensity in segment –2 of the same rays. N (experiments)=1; n (fins)=5 (DMSO), 4 (PMX205), 6 (SB290157); n (rays)=12. Error bars represent 95% CI. Kruskal-Wallis test. The observed relative difference is 1% for PMX205 and SB290157, the calculated smallest significant differences are 6% (PMX205) and 5% (SB290157), which are smaller than what we observe after retinoic acid treatment (Figure 4B; 7%).

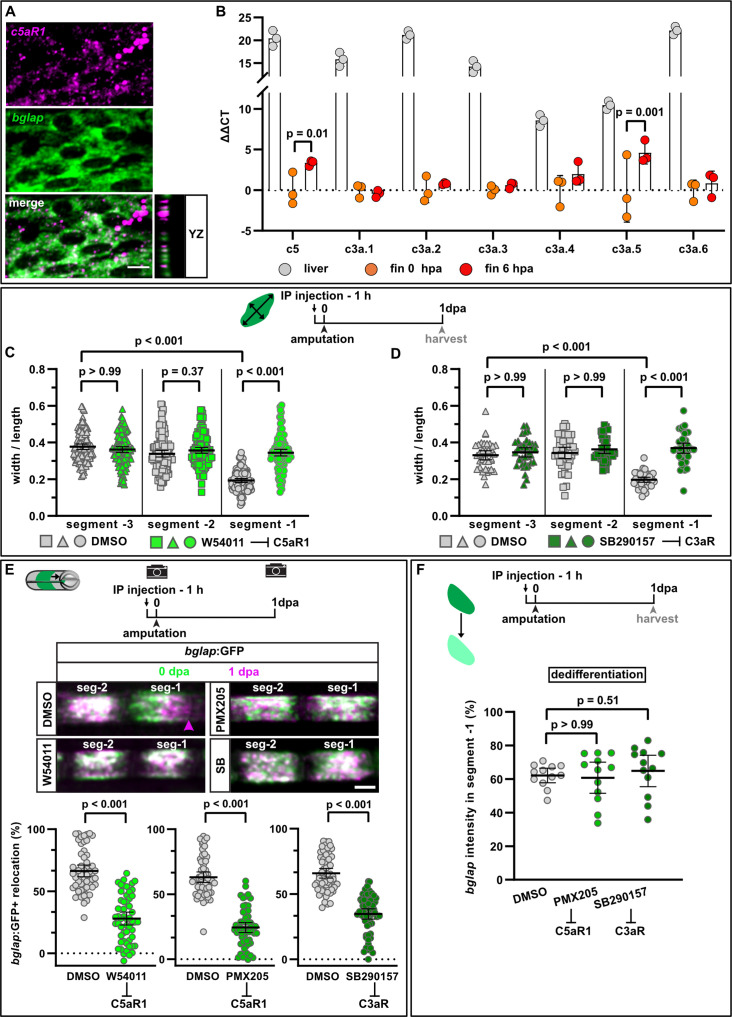
Figure 5—source data 1. Data and effect size calculations of experiments shown in Figure 5B, C, D, E and F, and Figure 5—figure supplement Figure 5—figure supplements 1B and 2B, C, D Figure 5—figure supplement 3A, B, C.
elife-77614-fig5-data1.xlsx (961.9KB, xlsx)

Figure 5.

Figure 5—figure supplement 1. Localisation of complement receptors in the zebrafish fin.

Figure 5—figure supplement 1.

(A) RNAscope in situ detection of c5aR1 and bglap expression in a non-injured fin ray segment. Yellow arrowheads, osteoblasts detected by bglap expression; white arrowheads, other cell types. Nuclei are stained by H34580. Scale bar, 10 µm. (B) Cells isolated from segment –1 and segment 0 of bglap:GFP fins at 1 day post amputation (dpa) were FACS-sorted for GFP and subjected to qRT-PCR. Both c5aR1 and c3aR1 are expressed in bglap:GFP osteoblasts (GFP+) as well as other cells (GFP−). Plotted are the ΔCT values relative to the average of two house-keeping genes. Error bars represent SD. Unpaired t-tests.
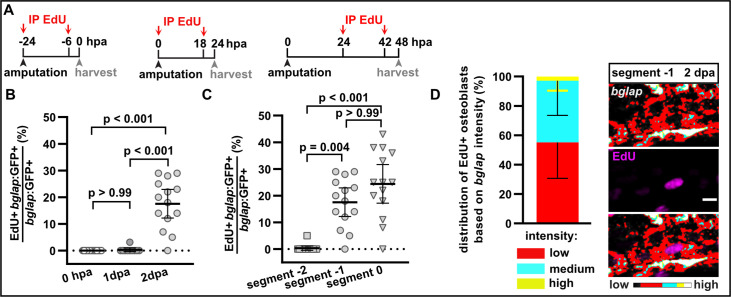
Figure 5—figure supplement 2. Proliferation of bglap:GFP+ osteoblasts.

Figure 5—figure supplement 2.

(A) Experimental scheme indicating EdU intraperitoneal (IP) injections used to label cycling osteoblasts harvested at different time points for the data presented in panels B–D. (B) Proliferation timeline of bglap:GFP+ osteoblasts in segment –1 as determined by EdU incorporation. N (experiments)=1, n (fins)=4 (0 hpa), 10 (1 day post amputation [dpa]), 9 (2 dpa); n (rays)=14 (0, 2 dpa), 10 (1 dpa). Error bars represent 95% CI. Kruskal-Wallis test. (C) Proliferation of bglap:GFP+ osteoblasts in segment –2, segment –1, and segment 0 at 2 dpa. N (experiments)=1, n (fins)=9, n (rays)=14. Error bars represent 95% CI. Dunn’s test. (D) bglap RNAscope expression levels of EdU+ cells in segment –1 at 2 dpa. bglap-expressing osteoblasts were categorised based on RNAscope signal intensity into ‘high’ (yellow), ‘medium’ (cyan), and ‘low’ (red) using a look-up table, with ‘high’ threshold corresponding to expression levels in segment –2. N (experiments)=1, n (fins)=9, n (rays)=12, n (cells)=62. Error bars repesent SD. Scale bar, 10 µm.
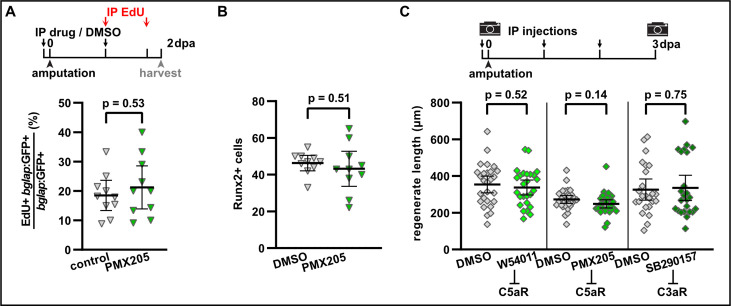
Figure 5—figure supplement 3. Complement system signalling is not required for osteoblast proliferation, dedifferentiation, and regenerative growth.

Figure 5—figure supplement 3.

(A) The fraction of proliferating osteoblasts (EdU+ bglap:GFP+) in segment –1 at 2 day post amputation (dpa) is not altered by intraperitoneal (IP) injection of PMX205. N (experiments)=1, n (fish)=10. Error bars represent 95% CI. Unpaired t-tests. The observed relative difference is 7%, the calculated smallest significant difference is 28%. (B) PMX205 does not affect the number of cells upregulating Runx2 as detected by immunofluorescence in segment 0 at 2 dpa. N (experiments)=1, n (fins)=10, n (rays)=10. Error bars represent 95% CI. Unpaired t-test. (C) Absolute regenerate length at 3 dpa is not affected by W54011, PMX205, or SB290157 treatment. N (experiments)=3, n (fins)=27 (W54011), 29 (PMX205), 24 (SB290157); appertaining controls have the same n. Error bars represent 95% CI. Unpaired t-tests. The observed relative difference is 8% (W54011), 13% (PMX205), and 6% (SB290157), the calculated smallest significant differences are 30% (W54011), 21% (PMX205), and 36% (SB290157), which are smaller than what we have observed previously in a large chemical screen (Mishra et al., 2020), suggesting that in principle our experiment had enough power to detect a similar effect size.
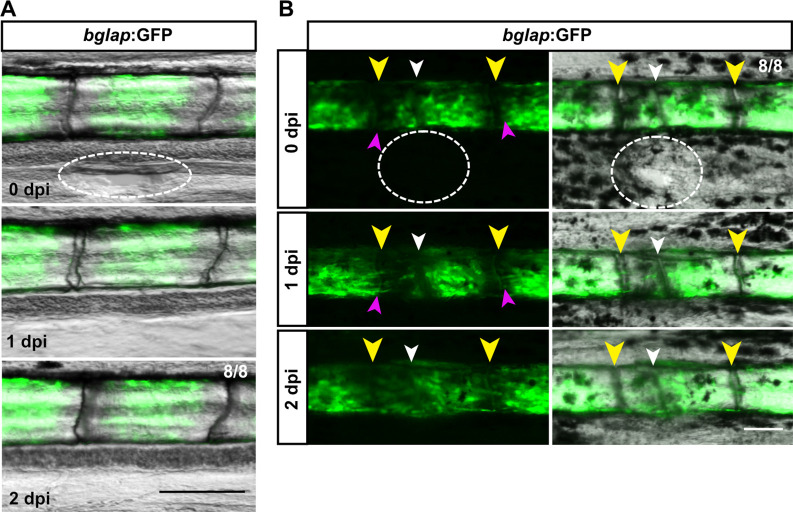
Figure 5—figure supplement 4. Injuries that do not trigger structural regeneration do not attract osteoblasts.

Figure 5—figure supplement 4.

(A) Incision in the interray skin (dashed oval) close to the bony ray does not induce migration of bglap:GFP+ osteoblasts from the bony ray into the interray mesenchyme. n=8/8 fins show no migration. Scale bar, 100 µm. (B) Incision in the interray (dashed oval) in combination with bone fracture (white arrowhead) induces migration of bglap:GFP+ osteoblasts towards the fracture (pink arrowheads), but not into the interray. Yellow arrowheads indicate joints. n=8/8 fins. Scale bar, 100 µm.