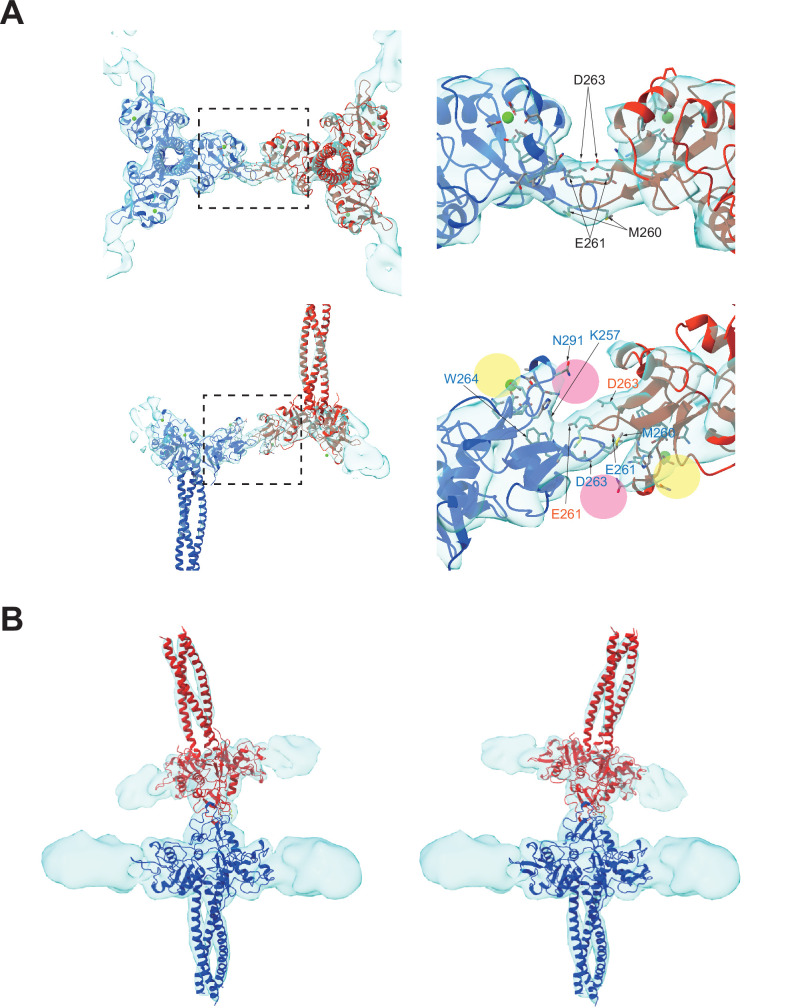
Figure 3. Binding interface between two langerin trimers.
(A) Two langerin trimers interact via the loops at residues 258–263. Amino acid codes and residue numbers are indicated. Yellow and pink circles indicate the primary and secondary carbohydrate-binding sites. The orientations of the side chains are speculative because the resolution of these maps (6.4 Å) was insufficient for precise modeling. Calcium ions (green) were placed based on the crystal structure (PDB ID: 3KQG). Top and side views are displayed in the top and bottom rows, respectively. Broken squares indicate the positions of the magnified views on the right. (B) Flexibility between the two trimers. The first eigenvector of the structural variation of the inverted trimer (red) relative to the upright trimer (blue) shows an approximately 30° rotation about the loop 258–263 (see Figure 3—video 1).

