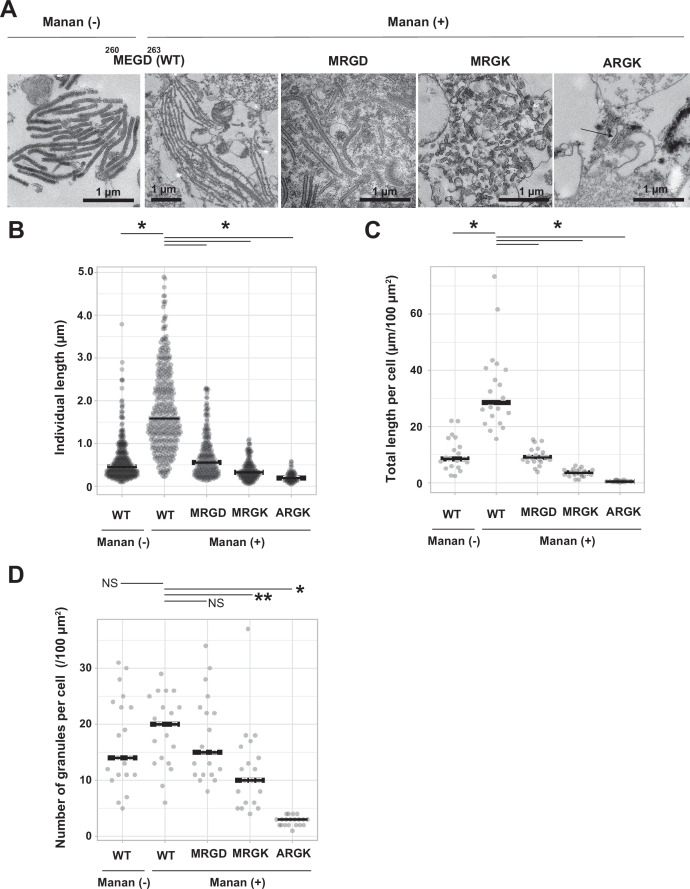
Figure 4. Mutations to the loop 258–263 disrupted Birbeck granule formation.
(A) Ultra-thin electron microscopy of Birbeck granules with and without yeast mannan in langerin-overexpressing 293T cells. Residues at 260–263 (Met-Glu-Gly-Asp, MEGD) were mutated to Met-Arg-Gly-Asp (MRGD), Met-Arg-Gly-Lys (MRGK), or Ala-Arg-Gly-Lys (ARGK). The Mannan (+) WT image has a lower magnification than the others in order to show the entire Birbeck granules. (B–D) Quantification of Birbeck granule formation. Horizontal lines indicate the median values. Single asterisks and the double asterisk indicate statistically significant differences with p<0.01 and p=0.0101, respectively. NS indicates no statistically significant differences. p values were calculated using Bonferroni-corrected Student’s t-tests. (B) Lengths of individual Birbeck granules were measured. N=337 (WT mannan-), 386 (WT mannan+), 348 (MRGD), 233 (MRGK), and 70 (ARGK). p=1.4 × 10–68 (WT mannan (-)), 2.6×10–46 (MRGD), 6.6×10–62 (MRGK), and 1.1×10⁻³⁵ (ARGK). (C) Sum of the length of Birbeck granules per 100 µm2 cell area. Cross-sections of cells with nuclei of >5 µm in diameter were selected and the total lengths of the Birbeck granules were measured within the cells. N=20 for all the samples. p=2.9 × 10⁻⁷ (WT mannan (-)), 5.0×10⁻⁸ (MRGD), 1.5×10⁻¹⁰ (MRGK), and 1.0×10⁻¹¹ (ARGK). (D) Number of the Birbeck granules per 100 µm2 cell area. N=20 for all the samples. p=0.85 (WT mannan (-)), 1.2 (MRGD), 0.005 (MRGK), and 2.2×10⁻¹³ (ARGK).

