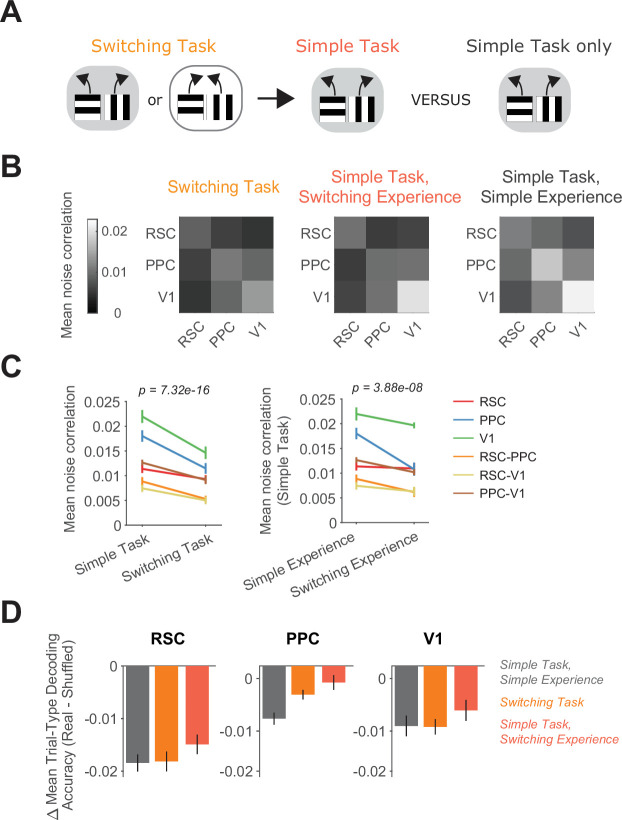
Figure 6. Switching task experience decreases noise correlations.
(A) Schematic of the training history sequence. One group of mice was first trained on the switching task and then permanently transitioned to the simple task. Another group was trained only on the simple task. (B) Mean pairwise noise correlations within and across areas from bootstrapped distributions of the mean in the switching task (left), the simple task with previous switching task experience (middle), and the simple task with only simple task experience (right). Noise correlations were calculated on spatially binned data in correct trials during high-performance periods (Methods). (C) Left: Comparison of mean noise correlations in the switching task versus the simple task, p value is for the task factor from a two-way analysis of variance (ANOVA; factors: task and area combination). Error bars indicate mean ± standard error of the mean (SEM) across sessions per area combination (n = 6 area combinations, n sessions: 12 (simple task) and 12 (switching task)). Right: Similar to left, except for the comparison of simple task noise correlations with and without previous switching task experience. n sessions: 12 (simple experience) and 8 (switching experience). (D) For each area and task or previous task experience, the difference in trial-type decoding accuracy between neural populations (200 subsampled neurons) with intact and disrupted noise correlations. Noise correlations were disrupted by shuffling trials independently for each cell within a given trial type. Error bars show mean ± SEM across sessions.

