. 2022 Jul 6;11:e76162. doi: 10.7554/eLife.76162

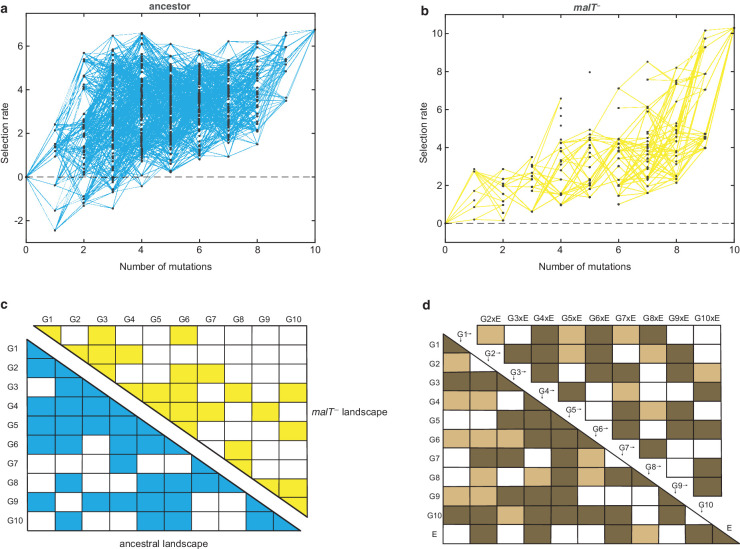
Figure 1. Empirical fitness landscapes of λ when infecting the (a) ancestral host and (b) malT host, and their statistical analyses in (c) and (d).

Each node in (a) and (b) represents a unique genotype and two nodes are connected by edges if the corresponding genotypes are separated by one mutation. The node at zero mutations is ancestral λ. Selection rate (per 4 hr competition experiment) is the difference of Malthusian growth rates of a given genotype i to ancestral λ over 4 hr, calculated as ln(λi,4λi,0)-ln(λanc,4λanc,0), where λi,t denotes the density of the given genotype at time t. (c) Statistical analysis of direct and interactive effects of mutations in both the landscapes. Colored cells represent statistically significant terms determined by multiple regression analysis after correction for multiple hypothesis testing (see Materials and methods). The diagonal elements of the matrix represent single mutation effects and all the off-diagonal terms represent pairwise epistatic interactions. See Supplementary file 1i for identity of mutations corresponding to different Gi . (d) Statistical test of whether the two landscapes varied in topology. The additional variable, E, represents environment (host) to indicate mutation-by-host effects in the lower-left matrix and mutation-by-mutation-by-host (G×G×E) in the upper-right matrix. Light colored cells indicate terms present in the final AIC-optimized model out of the full-factorial model (F76,726 = 37.45, p<0.0001), and dark colored cells indicate statistically significant terms after controlling for rate of false positives (see Materials and methods).

Figure 1.

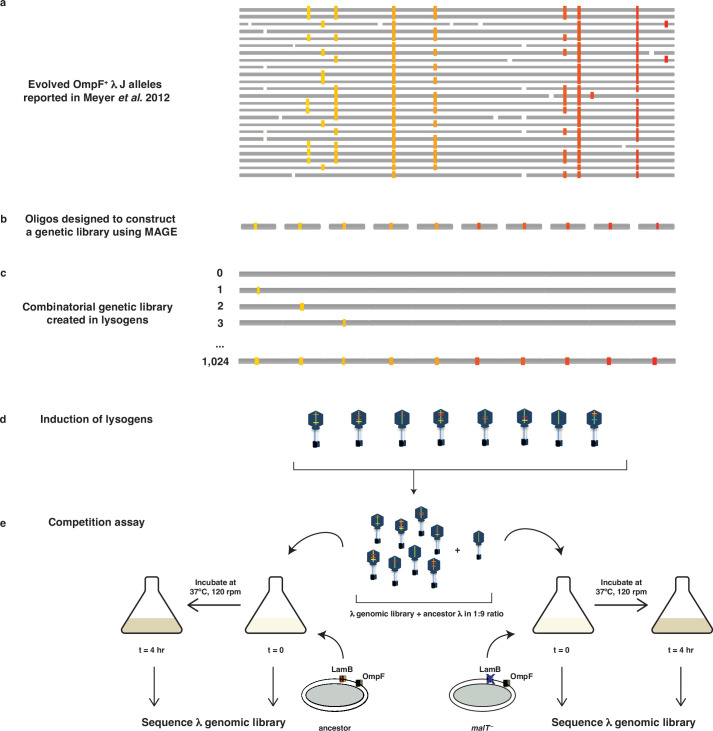
Figure 1—figure supplement 1. Schematic illustration of MAGE-Seq used to construct λ’s fitness landscapes.

Figure 1—figure supplement 1.

(a) 24 independently evolved J alleles reported in Meyer et al., 2012. The white blocks indicate a location of a mutation not studied here, whereas colored blocks indicate mutations used to construct the genetic library. (b) Oligos were synthesized with focal mutations positioned in the center of the sequence. (c) MAGE was used to construct a combinatorial library of lambda lysogens integrated into E. coli’s genome. (d) Lysogens were induced in order to generate a library of λ particles with different combinations of mutations. (e) The λ library was first mixed with the ancestor in 1:9 ratio, incubated with different types of hosts for 4 hr at 37°C, and then sequenced at both initial and final timepoints to calculate the selection rates of individual genotypes.
Figure 1—figure supplement 2. Test to determine whether amplification distorts measurements of fitness.
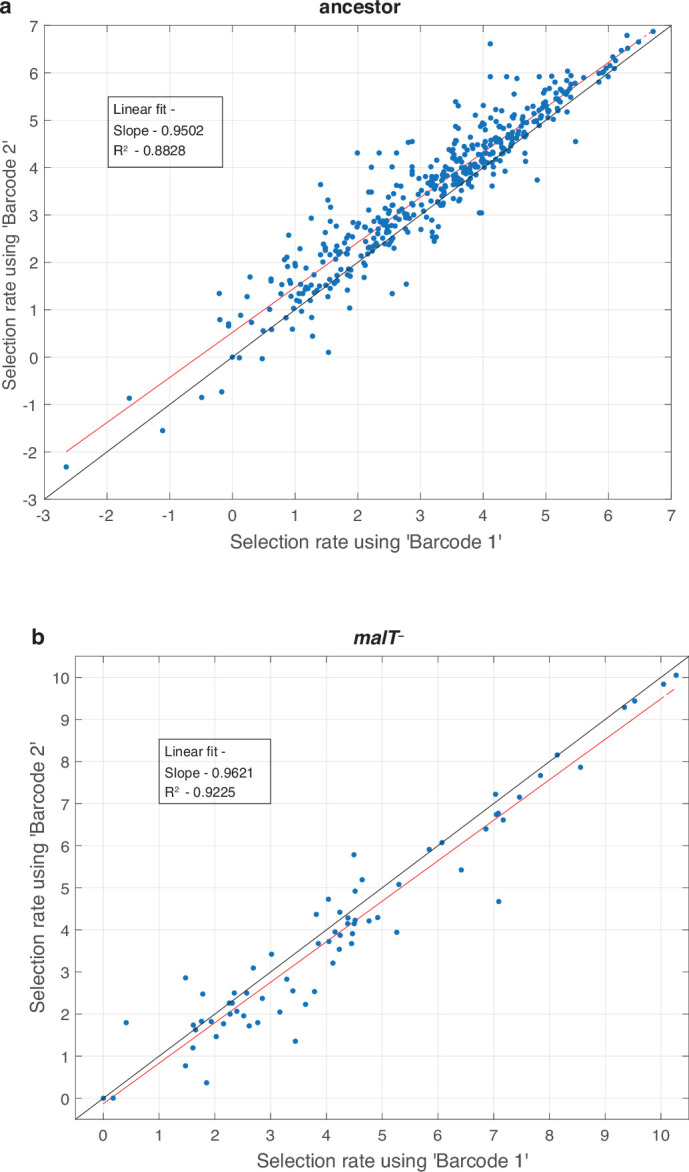
Figure 1—figure supplement 2.

For every replicate population in the competition (total eight, four for each host) we performed two separate amplifications and used a unique barcode for each. This allowed us to compare fitness calculations based on independent amplifications and to determine if the amplification step is repeatable and unbiased. Each point represents a unique λ genotype presented in the fitness landscapes reported in Figure 1. The red line is a linear least-square fit. The regression fitting parameter and coefficient of determination are provided in the inset. The black line represents the vector, where fitness estimates from each barcode are equal.
Figure 1—figure supplement 3. Distribution of λ genotypes present with respect to the number of mutations they possess.
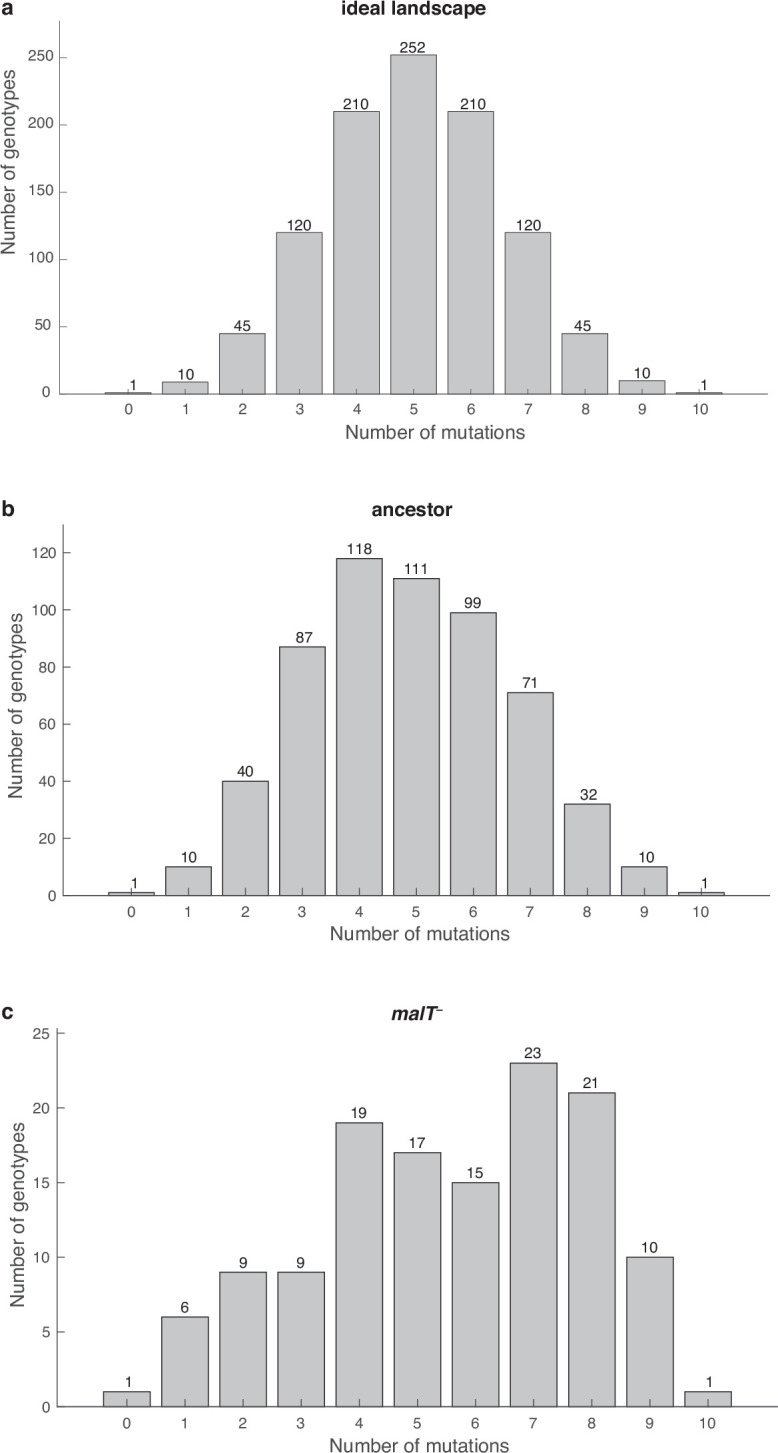
Figure 1—figure supplement 3.

(a) An ideal fitness landscape where all combinations of 10 mutations are present. (b and c) Empirical fitness landscapes with ancestral host and malT host, respectively.
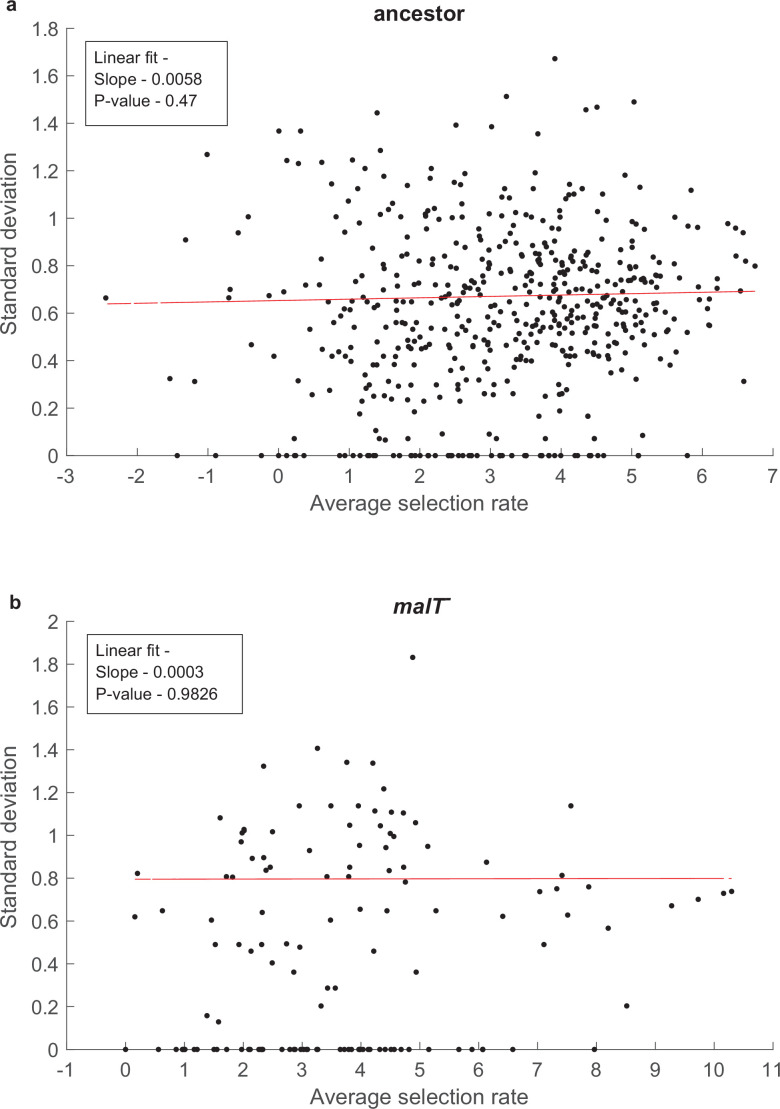
Figure 1—figure supplement 4. Test of whether the error in our estimates of selection rates (per 4 hr) is influenced by the magnitude of the estimate.

Figure 1—figure supplement 4.

SD does not correlate with mean fitness of a genotypes for both (a) ancestor host, and (b) malT host; p-values in the insets indicate that the slope is not significantly different than zero. Uniform variance in fitness values permit the performance of analysis of variance to detect genotype by genotype by host interactions. Points with zero SD indicate presence of only one replicate population with a fitness value for that genotype.