Figure 3. J evolution (a) and evidence of the interdependency between λ and E. coli fitness during their coevolution (b-d).
(a) Phylogenetic reconstruction and relative abundance of λ genotypes isolated through time from a previously coevolved community (Meyer et al., 2012). Each letter and star indicate a non-synonymous mutation in J (see Supplementary file 1c for labels’ corresponding mutations). A genotype’s relative abundance on a given day is denoted by the fraction of the total height of the y-axis that it occupies (e.g. on day 9, frequency of ABC is 0.2 and A**C is 0.8; see Supplementary file 1d). The lineage WT-A-ABC-ABCDE eventually evolves OmpF function and fixes in the population; resistance in E. coli through malT— rises to high frequencies between days 5 and 8 (Meyer et al., 2012). (b & c) Selection rates (per 24 hr) of phage genotypes on the two hosts. Each bar represents the mean of three experimental replicates. While mutation A is favored over wildtype (WT) λ in the presence of the ancestral host and not malT—, AB only outcompetes A in the presence of malT— and not the ancestral host. One tailed t-tests to test if the mean selection rate is significantly greater (or less) than zero: A vs WT with ancestor host- ; A vs WT with malT— - ; AB vs A with ancestor- ; AB vs A with malT— - . (d) Selection rate (per 4 hr) of malT– E. coli relative to its ancestor in the presence of λ from different stages of coevolution. Each competition was replicated three times. Lowercase letters denote significance via Tukey’s honest significance test, see Supplementary file 1g for pairwise p-values (ANOVA: F-ratio=111.22, d.f.=11, p<0.0001). One tailed t-tests were also used to test if the selection rate of malT— was greater than zero WT: ; A: ; ABC: ; A**C: . This shows that malT— is unlikely to evolve in the presence of WT λ but it becomes progressively more likely as λ gains mutations. Asterisks over all the competitions indicate significance level corresponding to the p-values. Error bars in all bar graphs represent one sample SD.

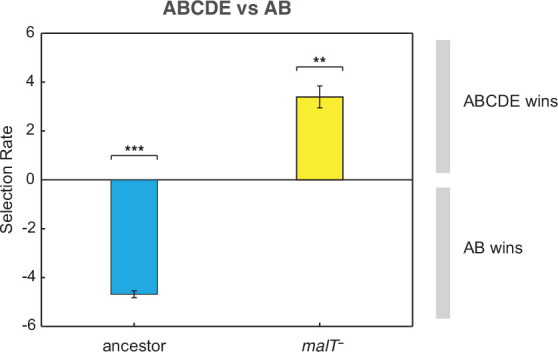
Figure 3—figure supplement 1. Competition assay of λ isolates from population D7.