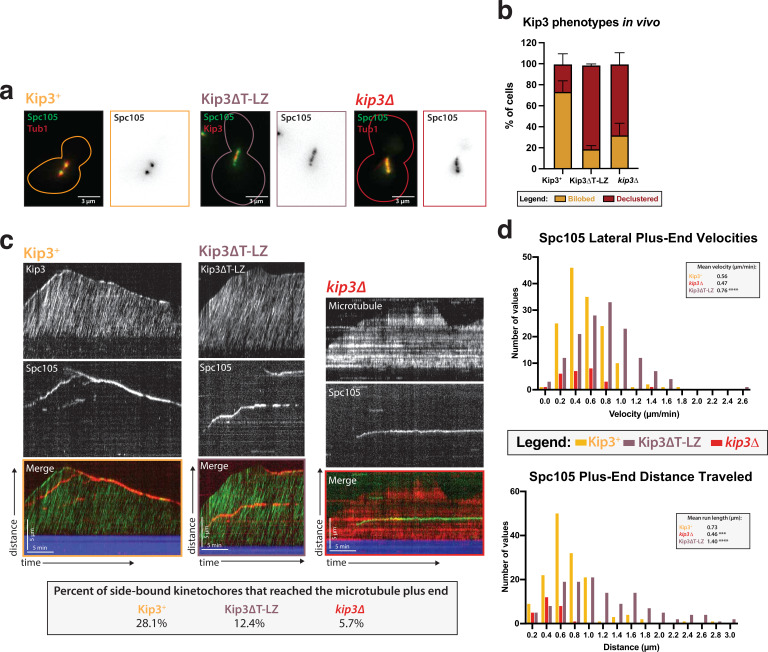
Figure 5. Kip3’s motor activity, but not its depolymerase tail domain, is necessary for processive plus end-directed kinetochore movement.
(a) Metaphase cells with either wild-type Kip3, kip3Δ, or kip3ΔT-LZ alleles imaged in a cdc23-1 strain expressing Spc105-GFP (green), mRuby-Tub1 or Kip3 (red). Note that the cells were not shifted to non-permissive temperature and were not arrested for imaging. Images are a maximum Z-projection of a 5 µm stack of 0.2 µm slices. (b) Quantification of the declustered kinetochore phenotype is shown as a bar graph for spindles that were 2–3 µm in length. Cells were classified as ‘bi-lobed’ by a line scan showing two distinct peaks. The ‘declustered’ phenotype included all line scans that did not show two peaks (line scans not shown). Two replicates were performed, each with n=50 cells. Error bars are standard error of the mean. (c) Representative kymographs of Spc105 motility in wild-type, kip3ΔT-LZ, and kip3Δ lysates. Dual color tagging of wild-type Kip3 and Spc105 showed no clear colocalization between the kinetochore (red) and Kip3 (green). Kip3 is highly processive, moving much faster than the kinetochore. A Kip3 mutant containing a deletion in the tail region (Kip3ΔT-LZ, green) with the kinetochore (red) was still processive along the microtubule. The Kip3ΔT-LZ mutant showed robust processivity but it did not accumulate on microtubule plus ends and depolymerization events were fewer than in Kip3 +lysates, as shown in previously published literature. Lastly, a representative kymograph for kip3Δ lysate shows immobile Spc105 (green) on microtubules (red). (d) Histograms of Spc105 velocities and average run length when laterally bound and moving toward the microtubule plus ends. The number of values is shown on the y-axis and velocity/distance traveled on the x-axis, binned every 0.2 units. The mean velocity of wild-type Kip3 protein and Kip3ΔT-LZ protein is 0.55 µm/min and 0.76 µm/min, respectively. The average run length also increased from 0.73 µm to 1.4 µm. The mean Spc105 velocity in kip3Δ lysates was unchanged compared to wild-type, but the number of runs was reduced to 25% of wild-type. The average length decrease in kip3Δ was reduced from 0.73 µm to 0.45 µm. The mean is from two replicate trials of one biological replicate. Statistical analysis was done using a Kruskal-Wallis test where *** p=0.0006 and **** p<0.0001. For lysates from each strain, as listed from WT to Kip3ΔT-LZ, N=128, 70, 81 kinetochores tracked.


