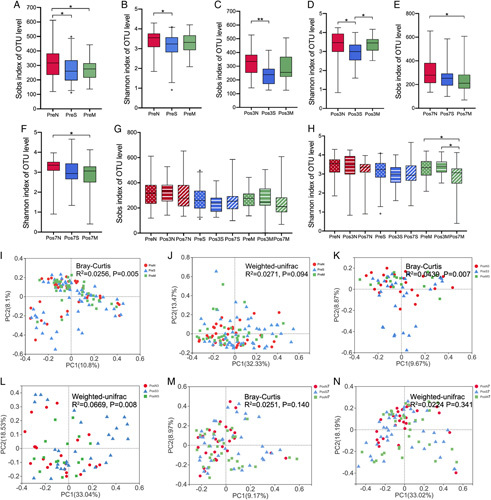
FIGURE 2.

Changes of fecal microbial diversities among the 3 groups. A, The Sobs index was lower in the pAD group. B, The NC group displayed significantly higher Shannon index compared with the SCD group before surgery. C, The NC group had a higher Sobs index than the SCD group on postoperative day 3. D, On postsurgery day 3, the Shannon index in the SCD was the lowest among the 3 groups. E and F, The Sobs index and Shannon index was lower in the aMCI group than in the NC group on postoperative day 7. G, The perioperative alteration of Sobs index among the 3 groups. H, There was a significant reduction in the Shannon index in the aMCI group on the postoperative day 7. I–N, Principal coordinate analysis (PCoA) of Bray-Curtis and weighted UniFrac analysis computed among the 3 groups during preoperative period. The Significance between the 3 groups at each time point was determined using Kruskal-Wallis test.
