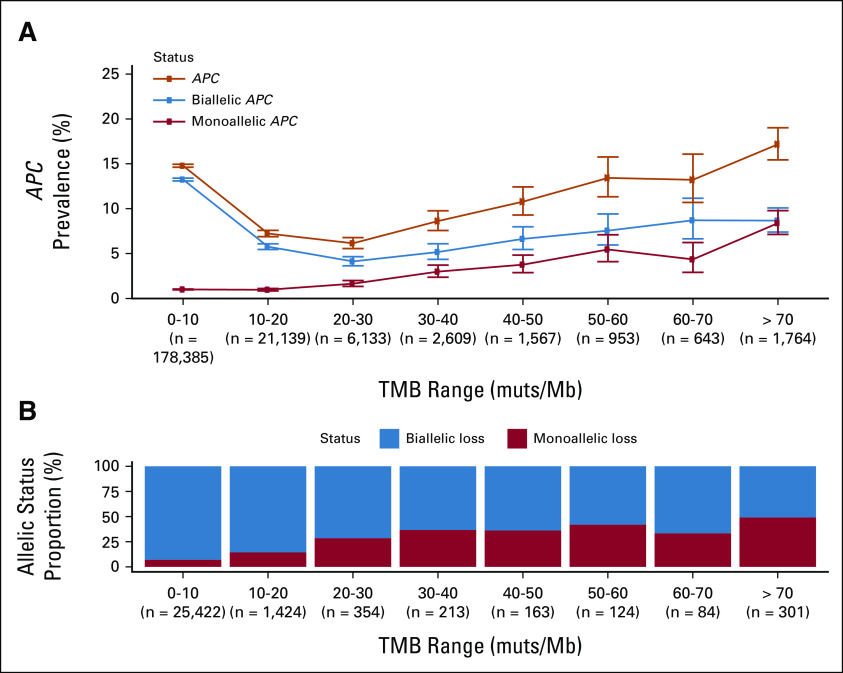
FIG A2.
Association of TMB with APC mutations (A) APC mutation prevalence binned on the basis of sample TMB (orange line). Predicted monoallelic (red) and biallelic (blue) mutation prevalence was plotted on the same axes. (B) Fraction of APC mutations predicted as monoallelic (red) and biallelic (blue) in each TMB bin; analyses were limited to samples where allelic status could be determined. TMB, tumor mutational burden.

