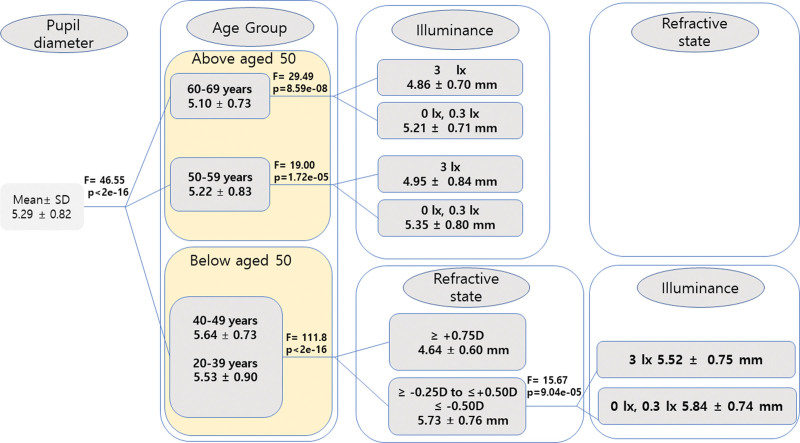
Figure 2.
CHAID tree diagram for the analysis of pupil diameter (dependent variable). Three independent variables, age, refractive state, and illuminance, are tested against the dependent variable during the branch split and 1 variable with the minimum P value is selected. The selected variables (or its levels) with the P and F values are shown. Varying degrees of pupil diameter (in mm) are shown based on their significance levels; the factors are differentiated forward through each branch based on their significance levels assessed using F values. The first level represents age as the most dominant factor (highest significance level), followed by illuminance (second-highest level of significance) and the least significant refractive state in participants over 50 yr of age. For participants under 50 yr of age, refractive state is the second-highest level of significance, followed by the least significant variable, illuminance. CHAID = chi-square automated interaction detection.

