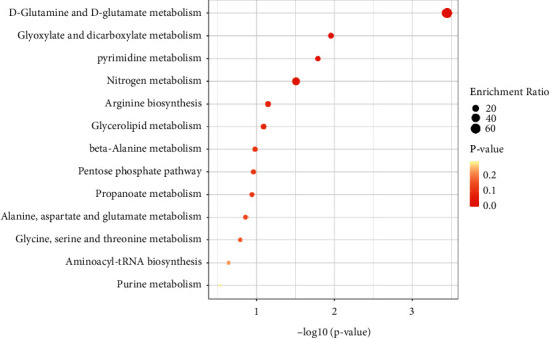
Figure 4.

Enrichment results of differential metabolite metabolic pathways in the cortex. The abscissa represents −log10P, the ordinate represents the enrichment pathway, and the bubble size represents the enrichment ratio. The darker the bubble color is, the smaller the P value is, as shown in Figure 5.
