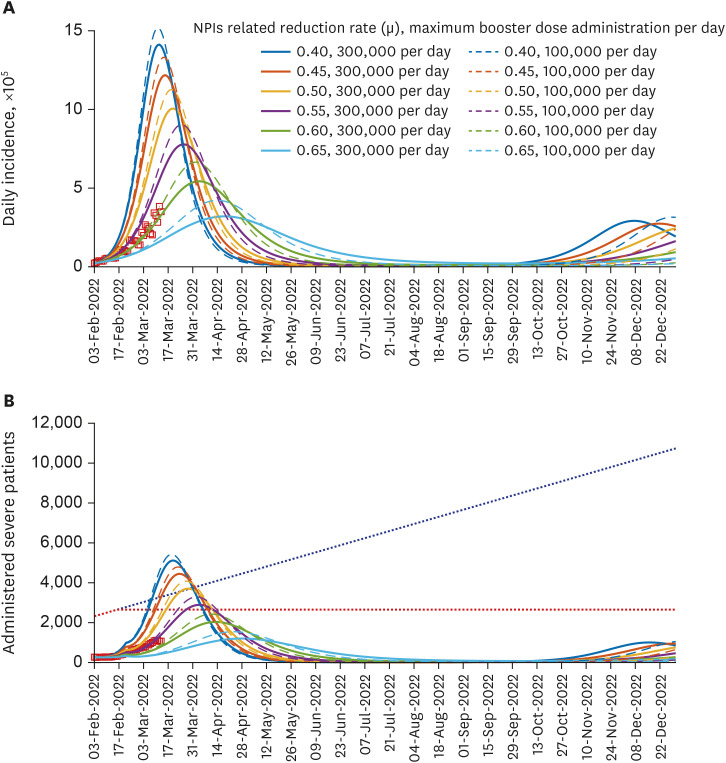
Fig. 4. Forecast results considering different intensity of NPIs and vaccine hesitancy. (A) Daily incidence. (B) Administered severe patient. Colors of model simulation curves indicate the value of NPIs related factor (µ). The solid and dashed curves correspond to maximum daily booster shot administration set to 300,000 and 100,000, respectively. Blue dotted line in (B) is the expected severe patient capacity assuming that the increasing trend continues (25.42 per day, based on historical data), while the red dotted line indicates a constant trend. Red boxes are the data points.
NPI = non-pharmaceutical intervention.

