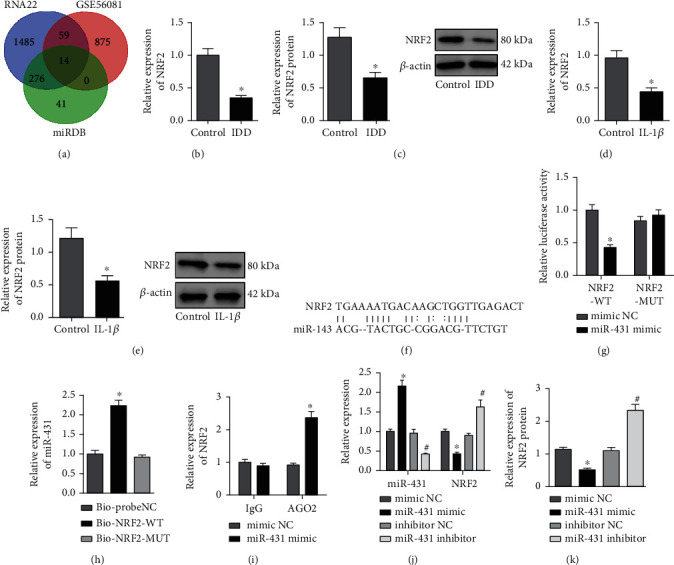
Figure 4.

miR-431 targets and negatively regulates NRF2. (a) Prediction of the downstream target genes of miR-431. The green circle represents the downstream target gene predicted by miRDB database. The blue circle represents the downstream target gene predicted by RNA22 database. The red circle represents the significantly downregulated mRNA screened in the IDD sample of GSE56081 dataset. The middle part represents the intersection of three datasets. (b) NRF2 mRNA level in NP tissues of IDD mice determined by RT-qPCR (n = 10, ∗p < 0.05vs. control mice). (c) NRF2 protein level in NP tissues of IDD mice determined by Western blot analysis (n = 10, ∗p < 0.05vs. control mice). (d) NRF2 mRNA level in IL-1β-treated NPCs determined by RT-qPCR (∗p < 0.05vs. control NPCs). (e) NRF2 protein level in IL-1β-treated NPCs determined by Western blot analysis (∗p < 0.05vs. control NPCs). (f) The binding site between miR-431 and NRF2 predicted by miRDB database. (g) The relationship between miR-431 and NRF2 verified by dual-luciferase reporter gene assay (∗p < 0.05vs. mimic NC). (h) The relationship between miR-431 and NRF2 verified by RNA pull-down assay (∗p < 0.05vs. Bioprobe NC or Bio-NRF2-MUT). (i) The interaction between miR-431 and NRF2 detected by RIP assay (∗p < 0.05vs. mimic NC). (j) miR-431 expression and NRF2 mRNA level in NPCs in response to miR-431 mimic or miR-431 inhibitor determined by RT-qPCR (∗p < 0.05vs. NPCs transfected with mimic NC; #p < 0.05vs. NPCs transfected with inhibitor NC). (k) NRF2 protein level in NPCs in response to miR-431 mimic or miR-431 inhibitor determined by Western blot analysis (∗p < 0.05vs. NPCs transfected with mimic NC; #p < 0.05vs. NPCs transfected with inhibitor NC). Cell experiments were repeated for three times independently.
