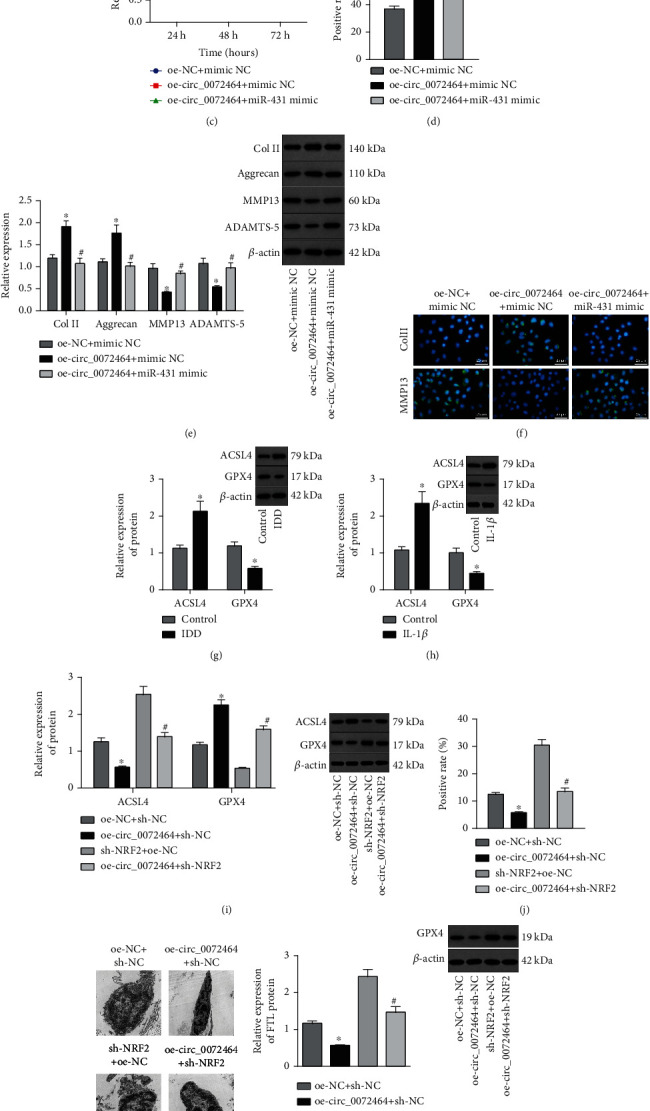
Figure 5.

circ_0072464 affects NPC ferroptosis via the miR-431/NRF2 axis. (a) Expression of circ_0072464, miR-431, and NRF2 in NPCs transduced with oe-circ_0072464 alone or combined with miR-431 mimic determined by RT-qPCR (∗p < 0.05vs. NPCs transduced with oe-NC+mimic NC and #p < 0.05vs. NPCs transduced with oe-circ_0072464+mimic NC). (b) NRF2 protein level in NPCs transduced with oe-circ_0072464 alone or combined with miR-431 mimic determined by Western blot analysis (∗p < 0.05vs. NPCs transduced with oe-NC+mimic NC and #p < 0.05vs. NPCs transduced with oe-circ_0072464+mimic NC). (c) Viability of NPCs transduced with oe-circ_0072464 alone or combined with miR-431 mimic detected by CCK8 assay (∗p < 0.05vs. NPCs transduced with oe-NC+mimic NC and #p < 0.05vs. NPCs transduced with oe-circ_0072464+mimic NC). (d) Proliferation of NPCs transduced with oe-circ_0072464 alone or combined with miR-431 mimic detected by EdU assay (∗p < 0.05vs. NPCs transduced with oe-NC+mimic NC and #p < 0.05vs. NPCs transduced with oe-circ_0072464+mimic NC). (e) Protein levels of Col II, Aggrecan, MMP13, and ADAMTS-5 in NPCs transduced with oe-circ_0072464 alone or combined with miR-431 mimic measured by Western blot analysis (∗p < 0.05vs. NPCs transduced with oe-NC+mimic NC and #p < 0.05vs. NPCs transduced with oe-circ_0072464+mimic NC). (f) Expression of Col II and MMP13 in NPCs transduced with oe-circ_0072464 alone or combined with miR-431 mimic determined by immunofluorescence staining. (g) Protein levels of GPX4 and ACSL4 in NP tissues of IDD mice determined by Western blot analysis (n = 10, ∗p < 0.05vs. control mice). (h) Protein levels of GPX4 and ACSL4 in IL-1β-treated NPCs determined by Western blot analysis (∗p < 0.05vs. control NPCs). (i) Protein levels of GPX4 and ACSL4 in NPCs transduced with oe-circ_0072464 and/or sh-NRF2 determined by Western blot analysis. (j) Cellular lipid ROS level of NPCs transduced with oe-circ_0072464 and/or sh-NRF2 detected by flow cytometry. (k) Mitochondrial morphology of NPCs transduced with oe-circ_0072464 and/or sh-NRF2 observed under the TEM. (l) FTL protein level in NPCs transduced with oe-circ_0072464 and/or sh-NRF2 measured by Western blot analysis. (m) Measurement of free iron levels in NPCs transduced with oe-circ_0072464 and/or sh-NRF2. In (e–i), ∗p < 0.05vs. NPCs transduced with oe-NC+sh-NC; #p < 0.05vs. NPCs transduced with oe-circ_0072464+sh-NC. Cell experiments were repeated for three times independently.
