
Figure 1.
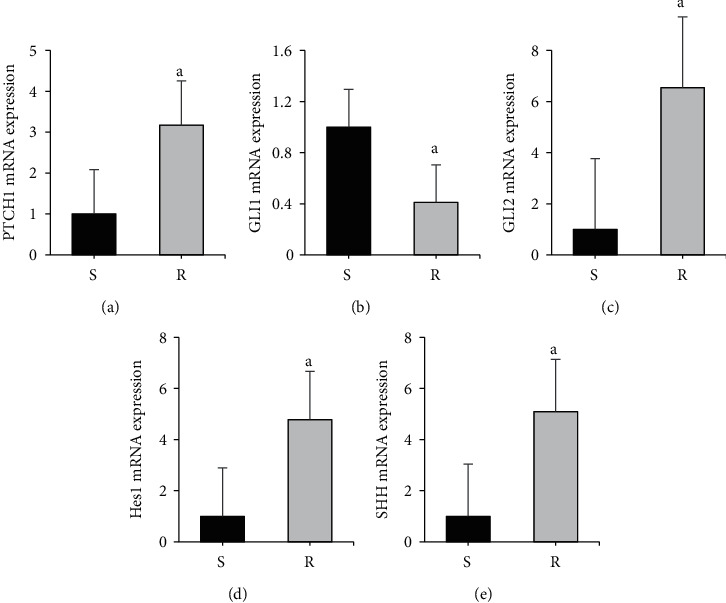
Comparison of mRNA expression differences of target genes in AZM-sensitive and drug-resistant myeloma cells. Note: A was PTCH1 level; B was GLI1 level; C was GLI2 level; D was Hes1 level; E was SHH level; compared with the S group, aP < 0.05.