
Figure 2.
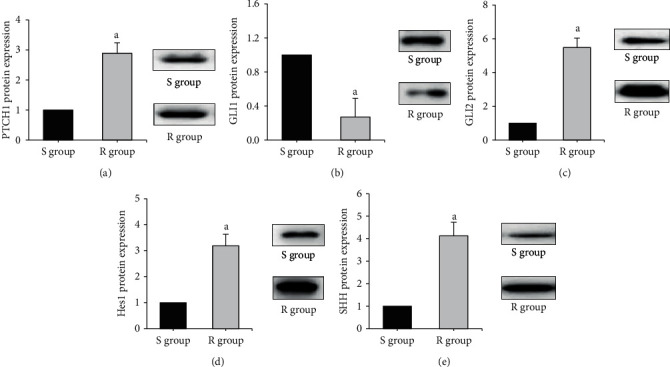
Comparison of target gene protein expression in AZM-sensitive and drug-resistant myeloma cells. (Note: A is PTCH1; B is GLI1; C is GLI2; D is Hes1; E is SHH, and a means statistically different from group S (P < 0.05)).
Official websites use .gov
A
.gov website belongs to an official
government organization in the United States.
Secure .gov websites use HTTPS
A lock (
) or https:// means you've safely
connected to the .gov website. Share sensitive
information only on official, secure websites.
Comparison of target gene protein expression in AZM-sensitive and drug-resistant myeloma cells. (Note: A is PTCH1; B is GLI1; C is GLI2; D is Hes1; E is SHH, and a means statistically different from group S (P < 0.05)).