
Figure 5.
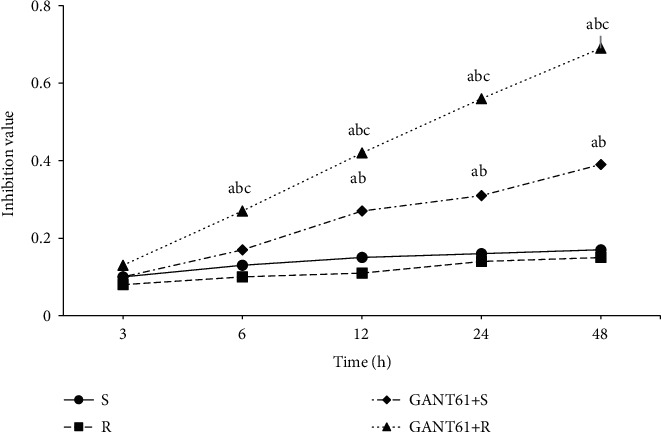
Proliferation inhibition curve of myeloma cells of different culture time. Note: compared with the S group, aP < 0.05; compared with the R group, bP < 0.05; compared with the GANT61+S group, cP < 0.05.
Official websites use .gov
A
.gov website belongs to an official
government organization in the United States.
Secure .gov websites use HTTPS
A lock (
) or https:// means you've safely
connected to the .gov website. Share sensitive
information only on official, secure websites.
Proliferation inhibition curve of myeloma cells of different culture time. Note: compared with the S group, aP < 0.05; compared with the R group, bP < 0.05; compared with the GANT61+S group, cP < 0.05.