
Figure 6.
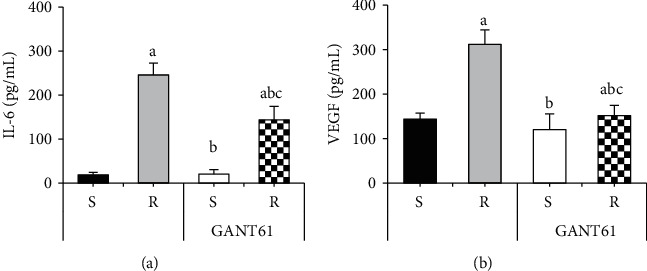
Comparison of IL-6 and VEGF contents in AZM-sensitive and drug-resistant myeloma cells treated with GANT61. Note: A was IL-6 content; B was VEGF content; compared with the S group, aP < 0.05; compared with the R group, bP < 0.05; compared with the GANT61+S group, cP < 0.05.