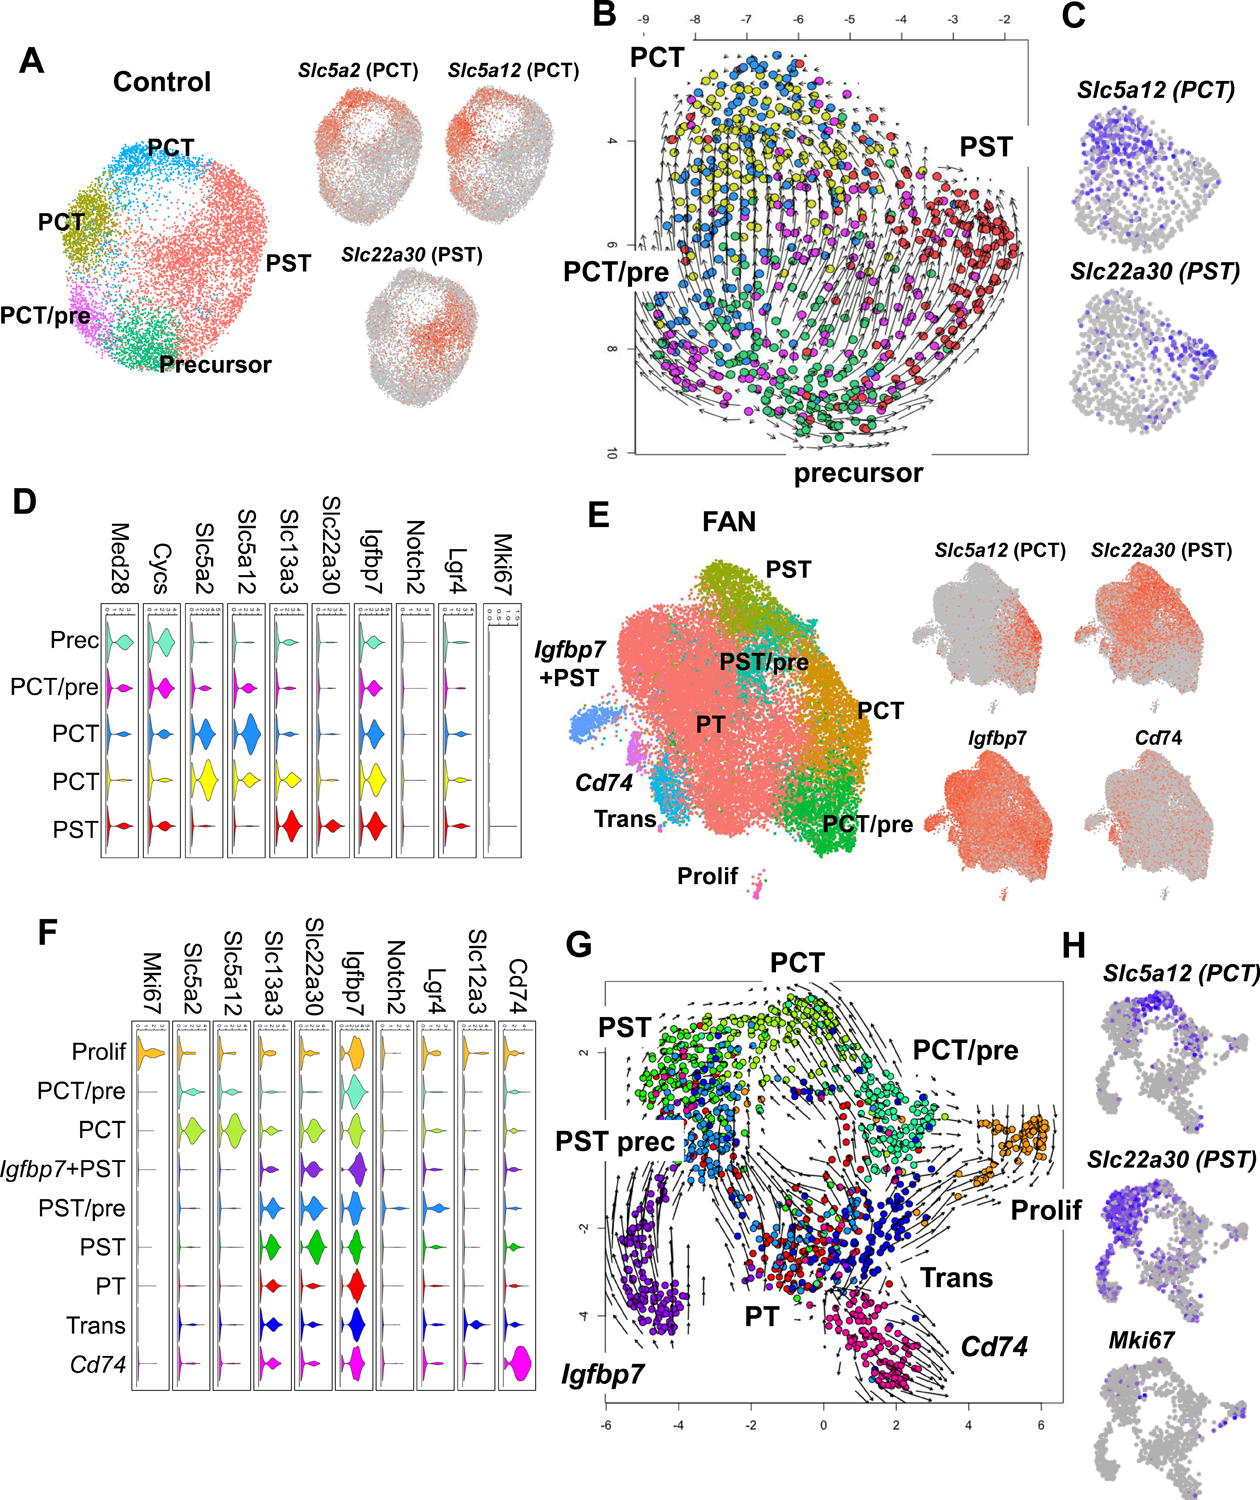
Figure 3. Heterogeneous proximal tubule cell populations in fibrotic kidneys.

(A) Sub-clustering of PT cells into 5 sub-populations in control kidneys. Feature plots showing expression of key PCT (Slc5a2 and Slc5a12) and PST (Slc22a30) segment markers.
(B) RNA velocity analysis of control PT cells. Each dot is one cell and each arrow represent the time derivative of the gene expression state.
(C) Feature plots showing expression of key PCT (Slc5a12) and PST (Slc22a30) segment markers in control.
(D) Violin plots showing the expression patterns of markers across the PT cell sub-clusters in control. The y-axis shows the log-scale normalized read count.
(E) Sub-clustering of PT cells into 9 sub-populations in FAN kidneys. Feature plots showing expression of key PCT (Slc5a12) and PST (Slc22a30), Igfbp7 (precursor) and Cd74 (immune) PT cell state markers.
(F) Violin plots showing the expression patterns of markers across the PT cell sub-clusters in FAN. The y axis shows the log-scale normalized read count.
(G) RNA velocity analysis of FAN PT cells. Each dot is one cell and each arrow represent the time derivative of the gene expression state.
(H) Feature plots showing expression of key PCT (Slc5a12) and PST (Slc22a30) and proliferating (MKi67) PT cell markers.
