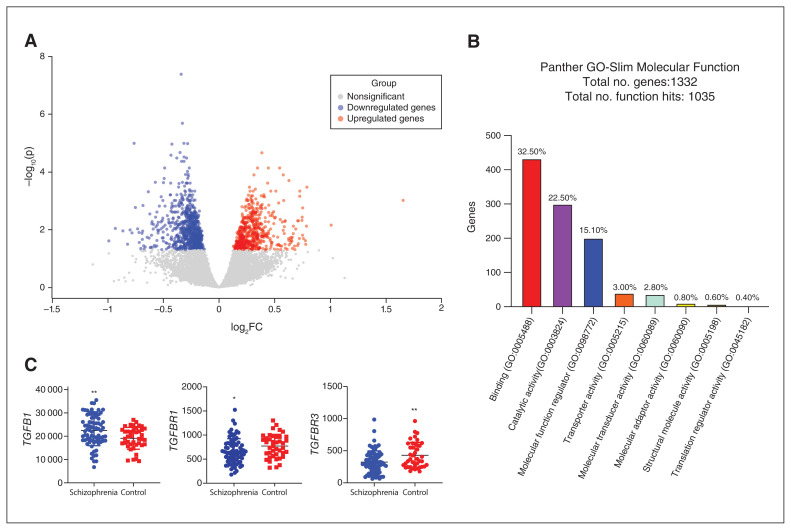
Figure 1.
RNA sequencing analysis in the peripheral blood of patients with schizophrenia and healthy controls. (A) Volcano plot representing differentially expressed genes among patients with schizophrenia and healthy controls. Only differentially expressed genes with adjusted p < 0.05 are shown in colour. (B) Functional enrichment analysis of the list of differentially expressed genes in the Panther database. Enriched Gene Ontology terms (GO-Slim Molecular Function) are presented. (C) RNA sequencing counts for TGFB1 and its receptors TGFBR1 and TGFBR3 in patients with schizophrenia and controls. TGFB1 was upregulated and TGFBR1 and TGFBR3 were downregulated in patients with schizophrenia compared to controls. One-way analysis of covariance. *p < 0.05; **p < 0.01; log2FC = log2 fold change.

