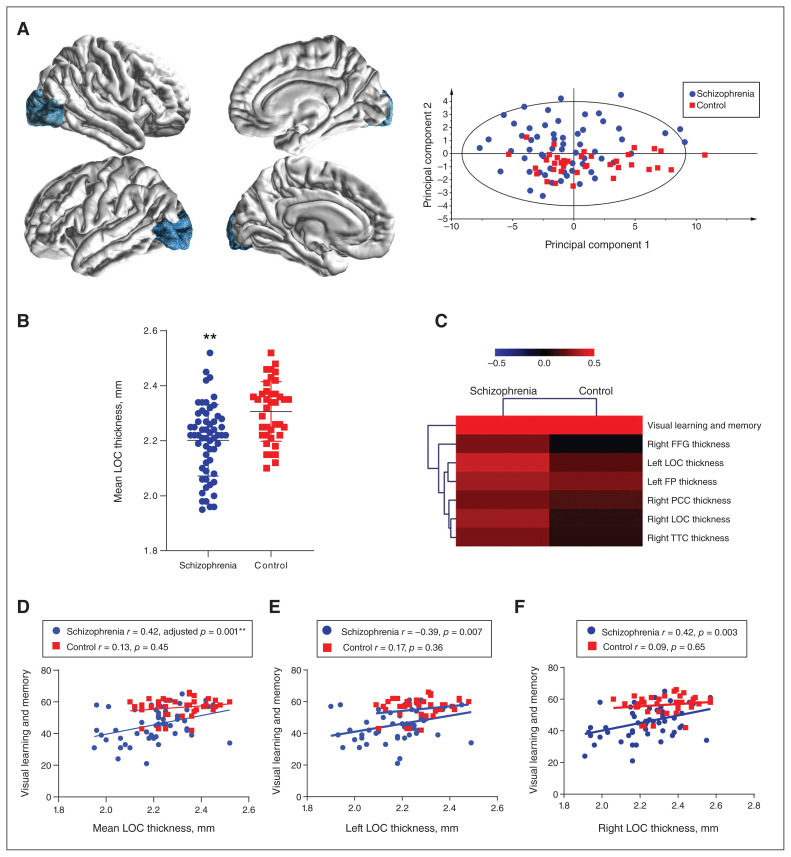
Figure 3.
Positive associations between visual brain cortical structures and cognitive performance in patients with schizophrenia. (A) An exemplar graph showing the location and shape of the LOC and a principal component analysis scatter plot showing the separation of the schizophrenia and healthy control groups by all 34 cerebral cortical MRI measures. In the imaging graphs, blue represents a decrease in cortical thickness. (B) The mean LOC thickness was significantly lower in patients with schizophrenia than in controls (2.20 ± 0.13 mm v. 2.31 ± 0.11 mm, adjusted p < 0.001). Data are expressed as mean ± standard deviation. (C) A heatmap of MRI features, which bears significant correlations with MATRICS Consensus Cognitive Battery visual scores in the schizophrenia group, shows hierarchical clustering of the features. (D–F) Visual learning and memory scores were positively associated with mean LOC thickness (adjusted p. = 0.001), left LOC thickness (unadjusted p = 0.007) and right LOC thickness (unadjusted p. = 0.003) in patients with schizophrenia but not controls. **Adjusted p < 0.01. FFG = fusiform gyrus; FP = frontal pole; LOC = lateral occipital cortex; PCC = pericalcarine cortex; TTC = transverse temporal cortex.

