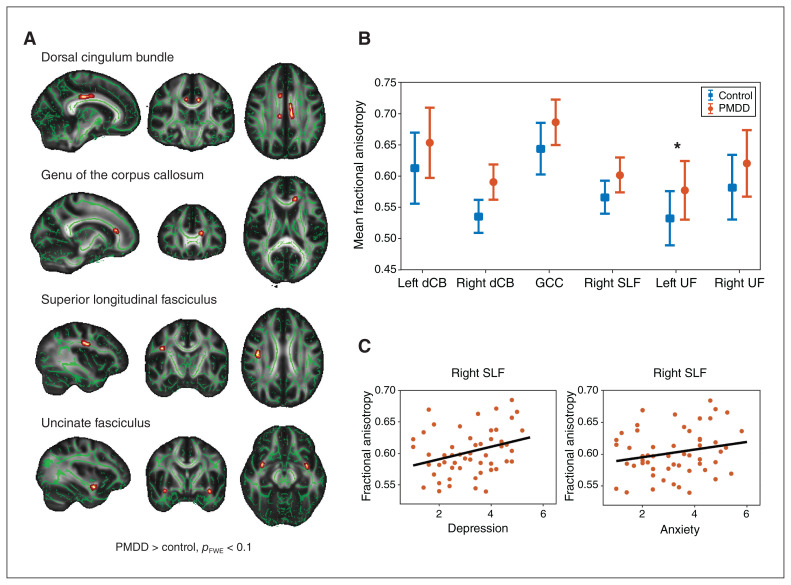
Figure 1.
Fractional anisotropy results in regions of interest. (A) Results from tract-based spatial statistics showing between-group differences in fractional anisotropy. Depicted in red–yellow are the 6 clusters in which we found greater fractional anisotropy in individuals with premenstrual dysphoric disorder compared to controls. The clusters are overlaid onto the mean fractional anisotropy skeleton (green) and displayed in 3-dimensional view at their peak Montreal Neurological Institute coordinates, in the standard radiology orientation (left–right flip). For visualization, results were thickened using the tbss_fill command in FSL. Results are visualized at a threshold of pFWE < 0.1, corrected for multiple comparisons across voxels with threshold-free cluster enhancement. (B) Between-group differences in fractional anisotropy in significant or trend clusters at p < 0.1 (left dorsal cingulum bundle p = 0.031; right dorsal cingulum bundle p = 0.070; genu of the corpus callosum p = 0.095; right superior longitudinal fasciculus p = 0.031; left uncinate fasciculus p = 0.024; right uncinate fasciculus p = 0.081). Error bars show 1 standard deviation across participants. *False discovery rate corrected across regions of interest at q < 0.1. (C) Correlation between scores on the Daily Record of Severity of Problems scale and fractional anisotropy values in clusters with a significant group difference at p < 0.1. We found positive associations between fractional anisotropy values from the right superior longitudinal fasciculus and Daily Record of Severity of Problems scores for depression (r = 0.350, p = 0.010) and for anxiety at a trend level (r = 0.262, p = 0.058). dCB = dorsal cingulum bundle; FWE = family-wise error; GCC = genu of the corpus callosum; PMDD = premenstrual dysphoric disorder; SLF = superior longitudinal fasciculus; UF = uncinate fasciculus.

