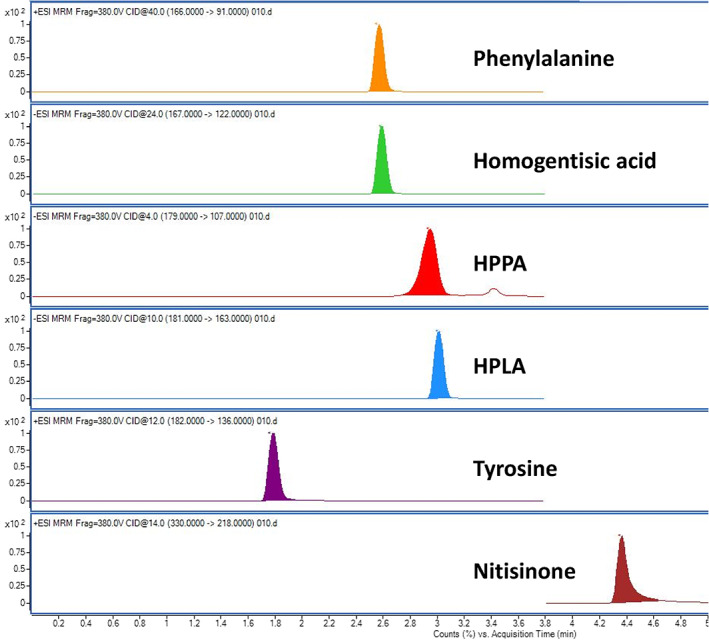
FIGURE 2.

Chromatogram showing all quantifiable metabolites related to AKU in the TYR pathway (no IS included in view). This is a serum sample (PHE, TYR, HPPA and HPLA 250 μmol/L, HGA 25 μmol/L, NTBC 5 μmol/L). AKU, alkaptonuria; HGA, homogentisic acid; HPLA, hydroxyphenyllactate; HPPA, hydroxyphenylpyruvate; MS, mass spectrometry; NTBC, nitisinone; PHE, phenylalanine; TYR, tyrosine
