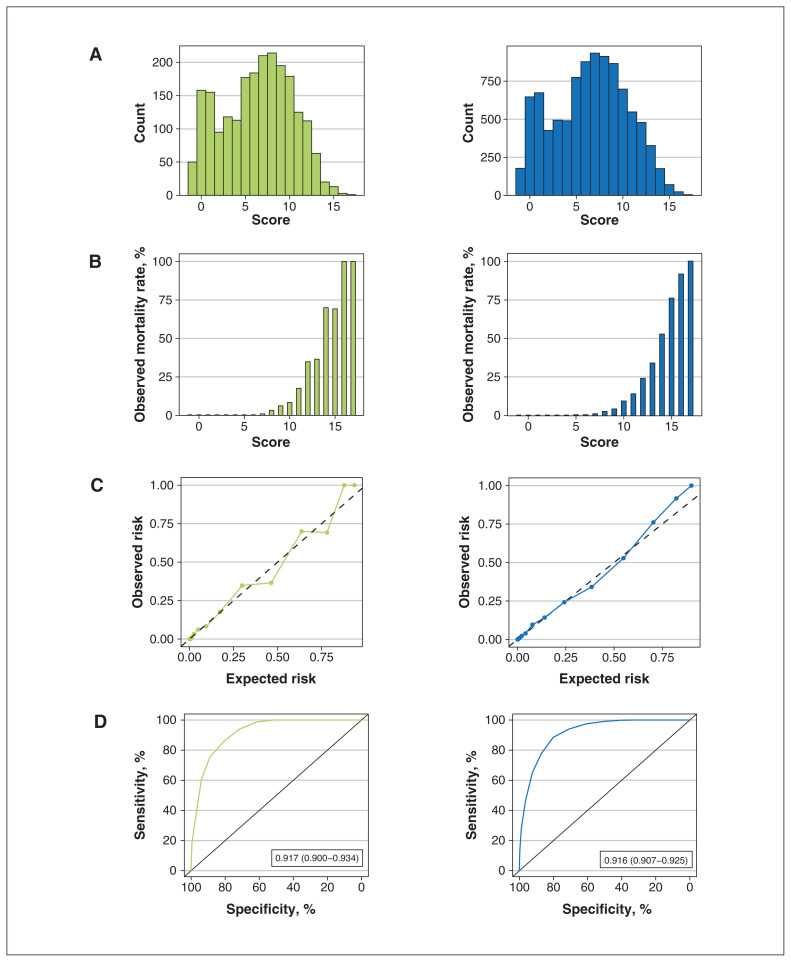
Figure 2:
Distribution and performance of the CCEDRRN COVID-19 Mortality Score in the validation cohort (left panel) and combined derivation and validation cohorts (right panel): (A) distribution of the score, (B) observed in-hospital mortality rates across the range of the score, (C) predicted versus observed risk of in-hospital death (dashed line represents line of no difference between predicted and observed risk) and (D) receiver-operating characteristic curve with area under the curve and associated 95% confidence interval.

