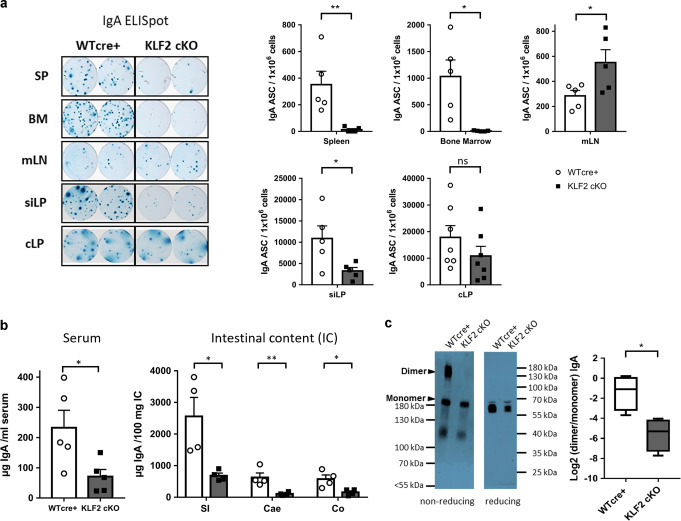
Fig. 3. Reduction of IgA-secreting plasma cells in the lamina propria of the gut affects the abundance of secreted luminal IgA in KLF2-deficient mice.
a Representative ELISpots and statistical analysis of SP, BM, mLN, siLP and cLP IgA-secreting cells of KLF2 cKO (gray bars, black squares) and WT cre+ control (white bars, white circles) mice; n = 5–7 mice, statistics were calculated by using an unpaired t-test. b ELISA analysis of serum IgA concentrations (left), mean with SEM, n = 5 mice; and ELISA analysis of secreted IgA (SIgA) in intestinal content (IC) of the small intestine (SI), Cecum (Cae) and Colon (CO) (right) of KLF2 cKO (gray bars, black squares) and WT cre+ control (white bars, white circles) mice, mean concentrations with SEM, n = 4; statistics were calculated with unpaired t-test. c Non-reducing and reducing western blot analysis of natural monomeric and dimeric IgA in the serum of WT cre+ control and KLF2 cKO mice. Non-reducing conditions (left): monomeric IgA (~180 kDa) and dimeric IgA (~360 kDa). Reducing conditions (right): IgA (α heavy chain: ~60 kDa). Box plot diagram shows Log2 dimer to monomer ratio of serum IgA in WT cre+ controls (white box plot) and KLF2 cKO (gray box plot) mice. The relative amount of IgA was determined by analysis of the “area under the curve” in ImageJ using the “gel analysis” tool. Box plots show arithmetic mean ± SEM, n = 4 mice; unpaired t-test. BM bone marrow, SP spleen, mLN mesenteric lymph nodes, siLP small intestine lamina propria, cLP colon lamina propria, IC intestinal content, ns non-significant; *p < 0.05; **p < 0.01.

