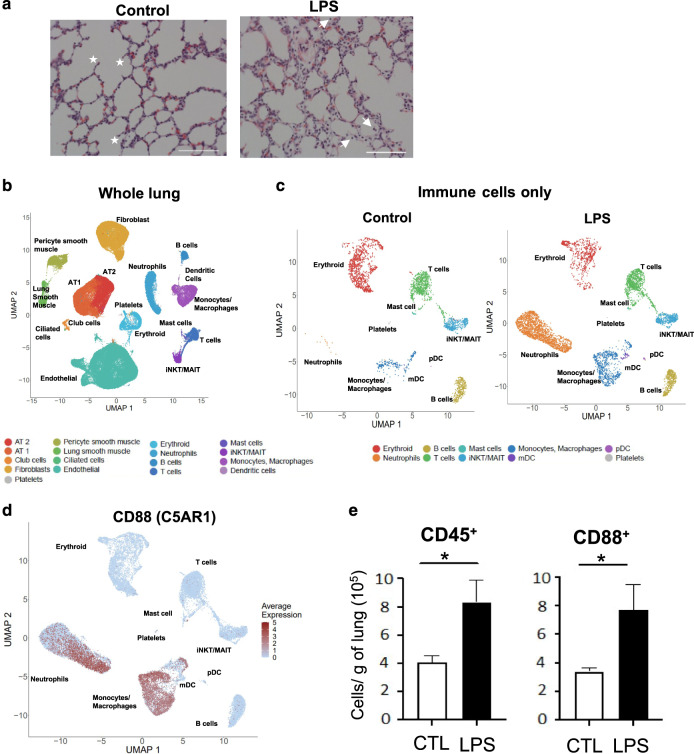
Fig. 1. Analysis of the fetal lung 16 h post IA LPS exposure.
a Representative 20x H&E stain of fetal lung from control and IA LPS-exposed fetuses; stars denote secondary septa, arrows represent infiltrating cells in alveolar space and scale bar is 100 μm. b–f The left lobe of fetal lung was processed into single-cell suspensions and submitted for single-cell sequencing. b UMAP from combined control and LPS- exposed animals (2 animals/condition). c Control (left) and IA LPS (right) exposed animals UMAP of re-clustered immune cell populations. d Feature plot of C5AR1 expression across hematopoietic cell populations. e Absolute number of hematopoietic (CD45+) and myeloid (CD88+) cells in control and IA LPS was calculated based on flow cytometric analyses of fetal lungs (n = 4). Each symbol represents one animal, with mean (SEM) cells/g tissue displayed; Student’s unpaired t test, *p < 0.05.

