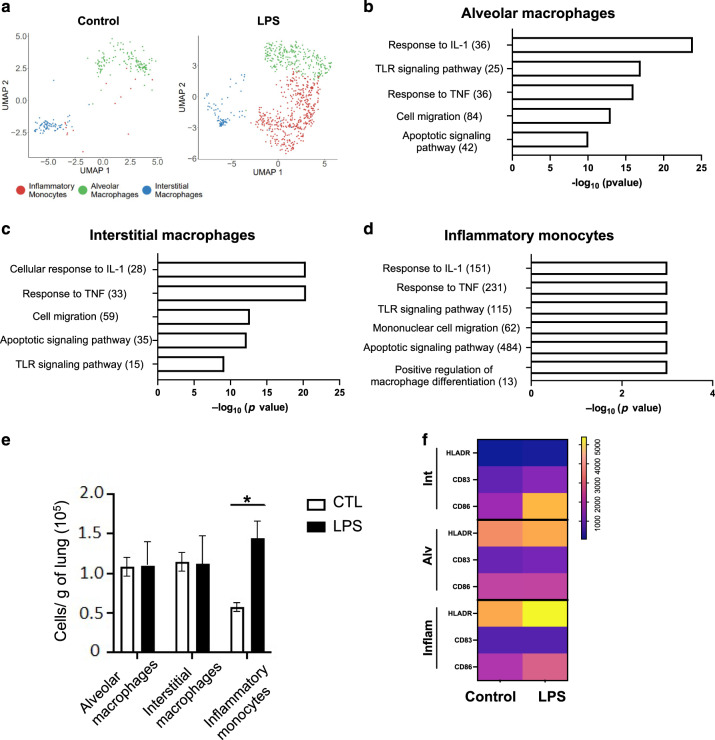
Fig. 2. Fetal lung monocyte/macrophage response to IA LPS.
a UMAPs of fetal lung myeloid cell populations in control (left) and IA LPS (right) fetuses. Functional enrichment analysis of upregulated biological processes based on differentially expressed genes (b: alveolar, c: interstitial macrophages) using ToppFun. d ssGSEA analysis of enriched gene ontology (GO) terms in inflammatory monocytes. Numbers in parentheses represent the total number of genes for each process. e Absolute number of macrophages in control and IA LPS was calculated based on flow cytometric analyses of fetal lungs (n = 4/group). Mean (SEM) cells/g tissue are shown; Student’s unpaired t test, *p < 0.05. f Activation markers expression by lung monocyte/macrophage subpopulations was analyzed by flow cytometry (see Supplementary Fig. S5B for representative flow plots). Data are represented as heatmap, the scale representing the range of geometric mean fluorescence.

