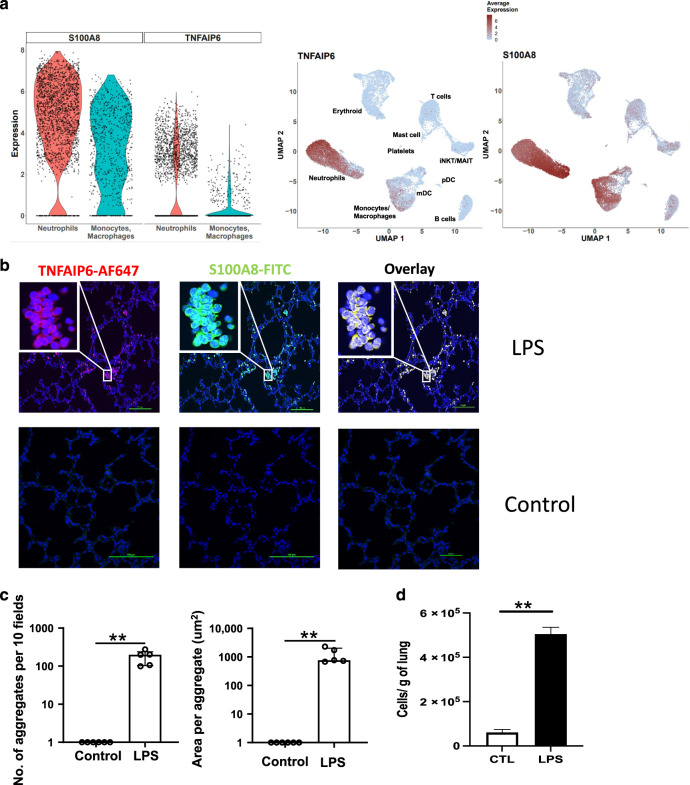
Fig. 3. Fetal lung neutrophil response to IA LPS.
a Violin (left) and feature (right) plot of TNFIAP6 and S100A8 expression in fetal lung neutrophils and monocyte/macrophage population following IA LPS. b Immunofluorescence of IA LPS-exposed fetal lung stained for S100A8 and TNFAIP6 (40X, Insert: 100X); scale bar is 100 μm. c Neutrophil aggregate count (left) and area (right) in the fetal lungs of control and IA LPS fetuses. Data presented as median and interquartile range, Mann–Whitney U test; **p ≤ 0.01. d Absolute number of neutrophils in control and IA LPS was calculated based on flow cytometric analyses (n = 4) (see Supplementary Fig. S6D for representative flow plot). Data are presented as mean (SEM) cells/g tissue, Student’s unpaired t test; **p ≤ 0.01.

